Which cell phone carrier has the best coverage? Verizon covers the largest number of Americans with 70% nationwide coverage, followed closely by AT&T at 68%, and if we take these coverage charts at face value, T-Mobile is a few steps behind AT&T at 62%, and Sprint is well behind the bottom of the pack at 30%.
With so many cell phone carriers to choose from, wouldn’t we want to pick the one with the best service in our area? Choosing the best carrier for you isn’t about getting the best overall coverage. It’s about which carrier will keep you connected where you spend most of your time.
You’re thinking about switching your cell phone package, but aren’t sure where to start. Before switching plans, it’s a good idea to compare wireless carrier coverage to see which carriers offer the best service where you live. In this article, I will compare coverage maps to explain which cell phone carriers have the best coverage!
Let’s Compare The Coverage of The Top Four Major Cell Phone Carriers
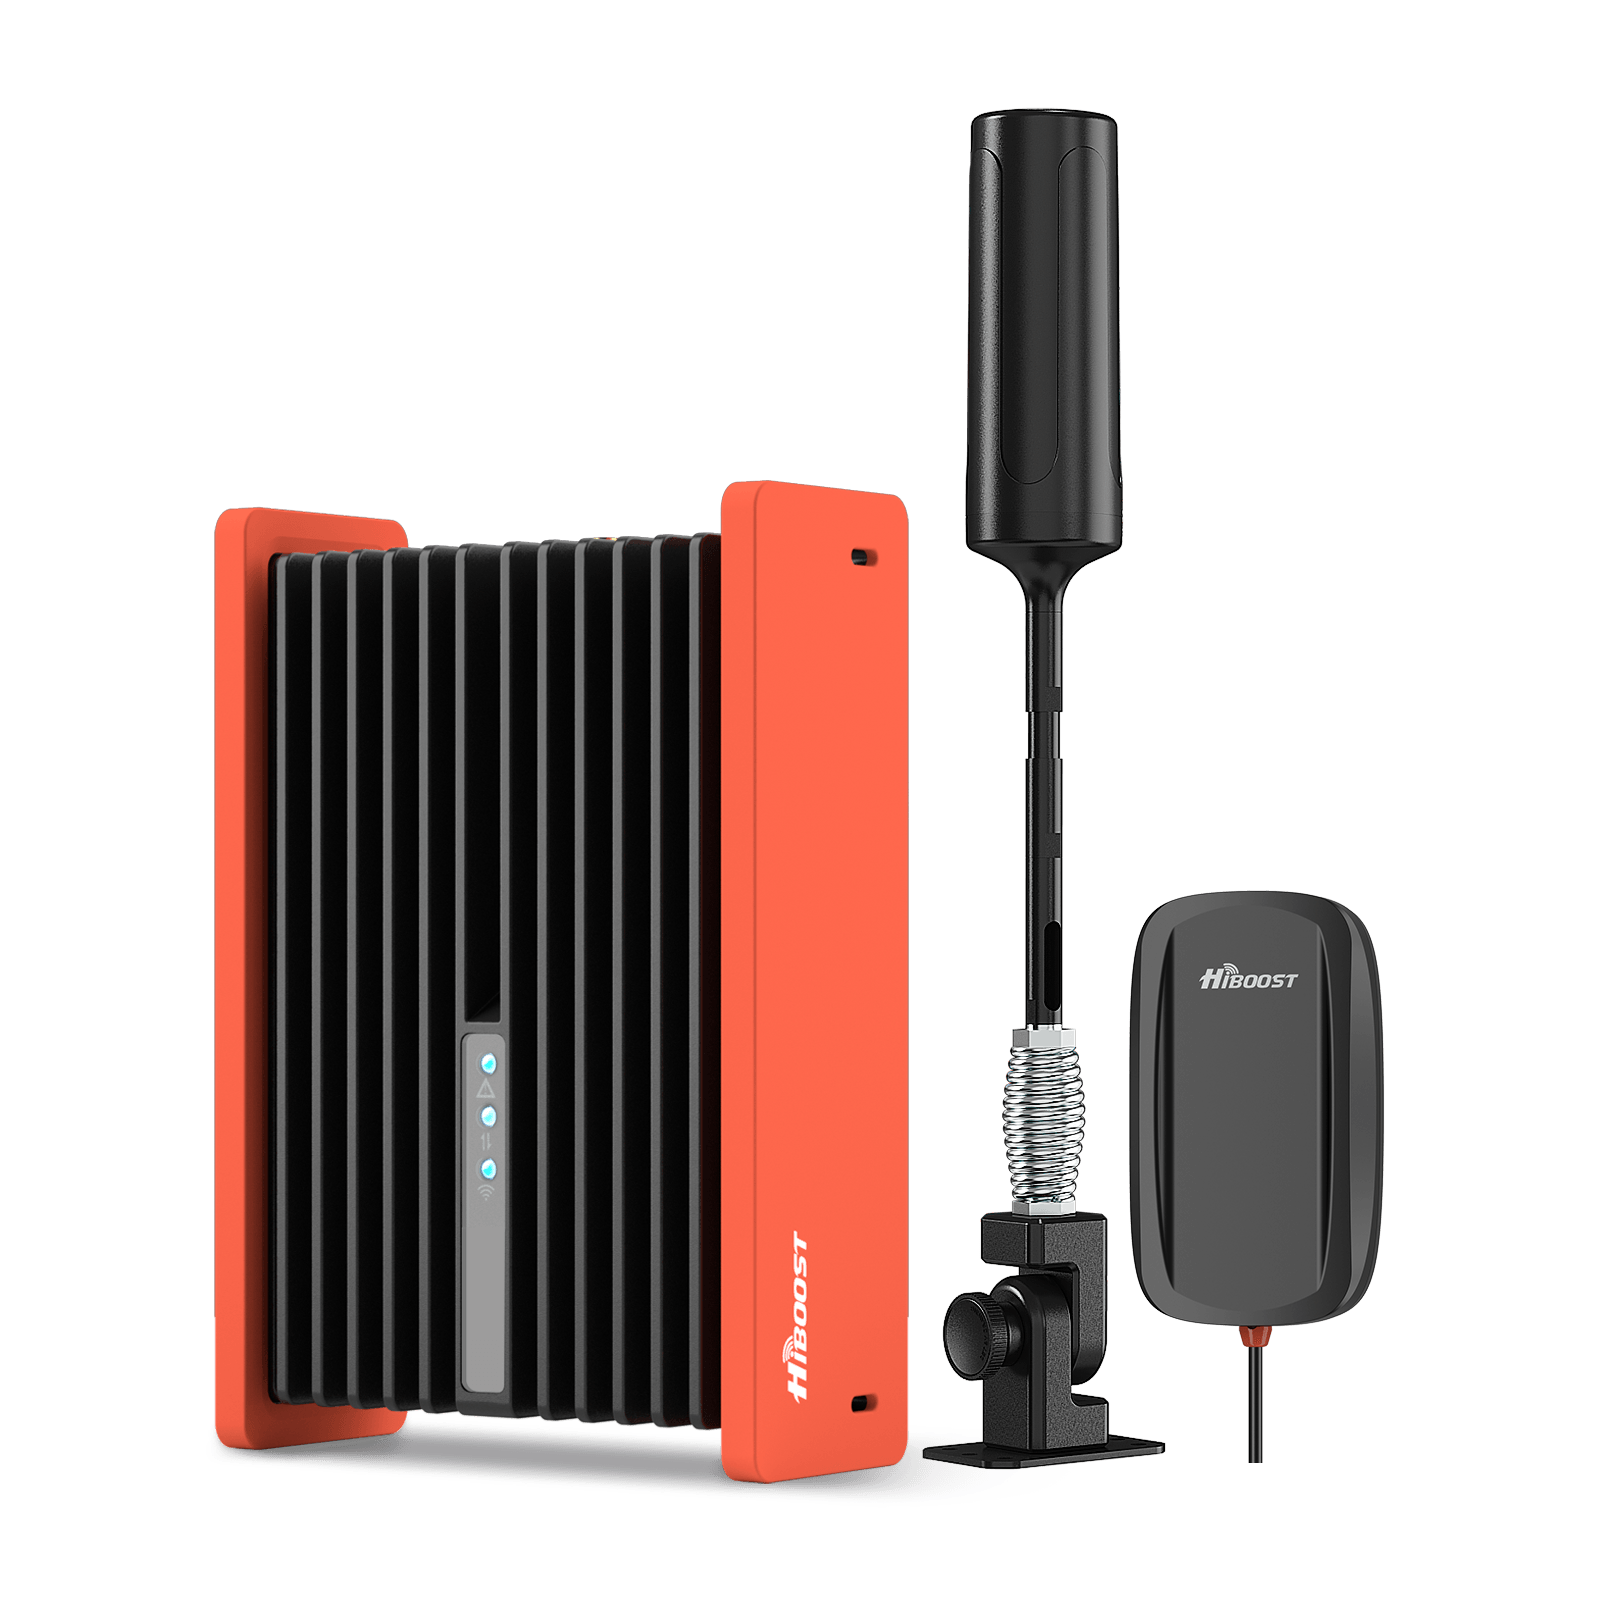
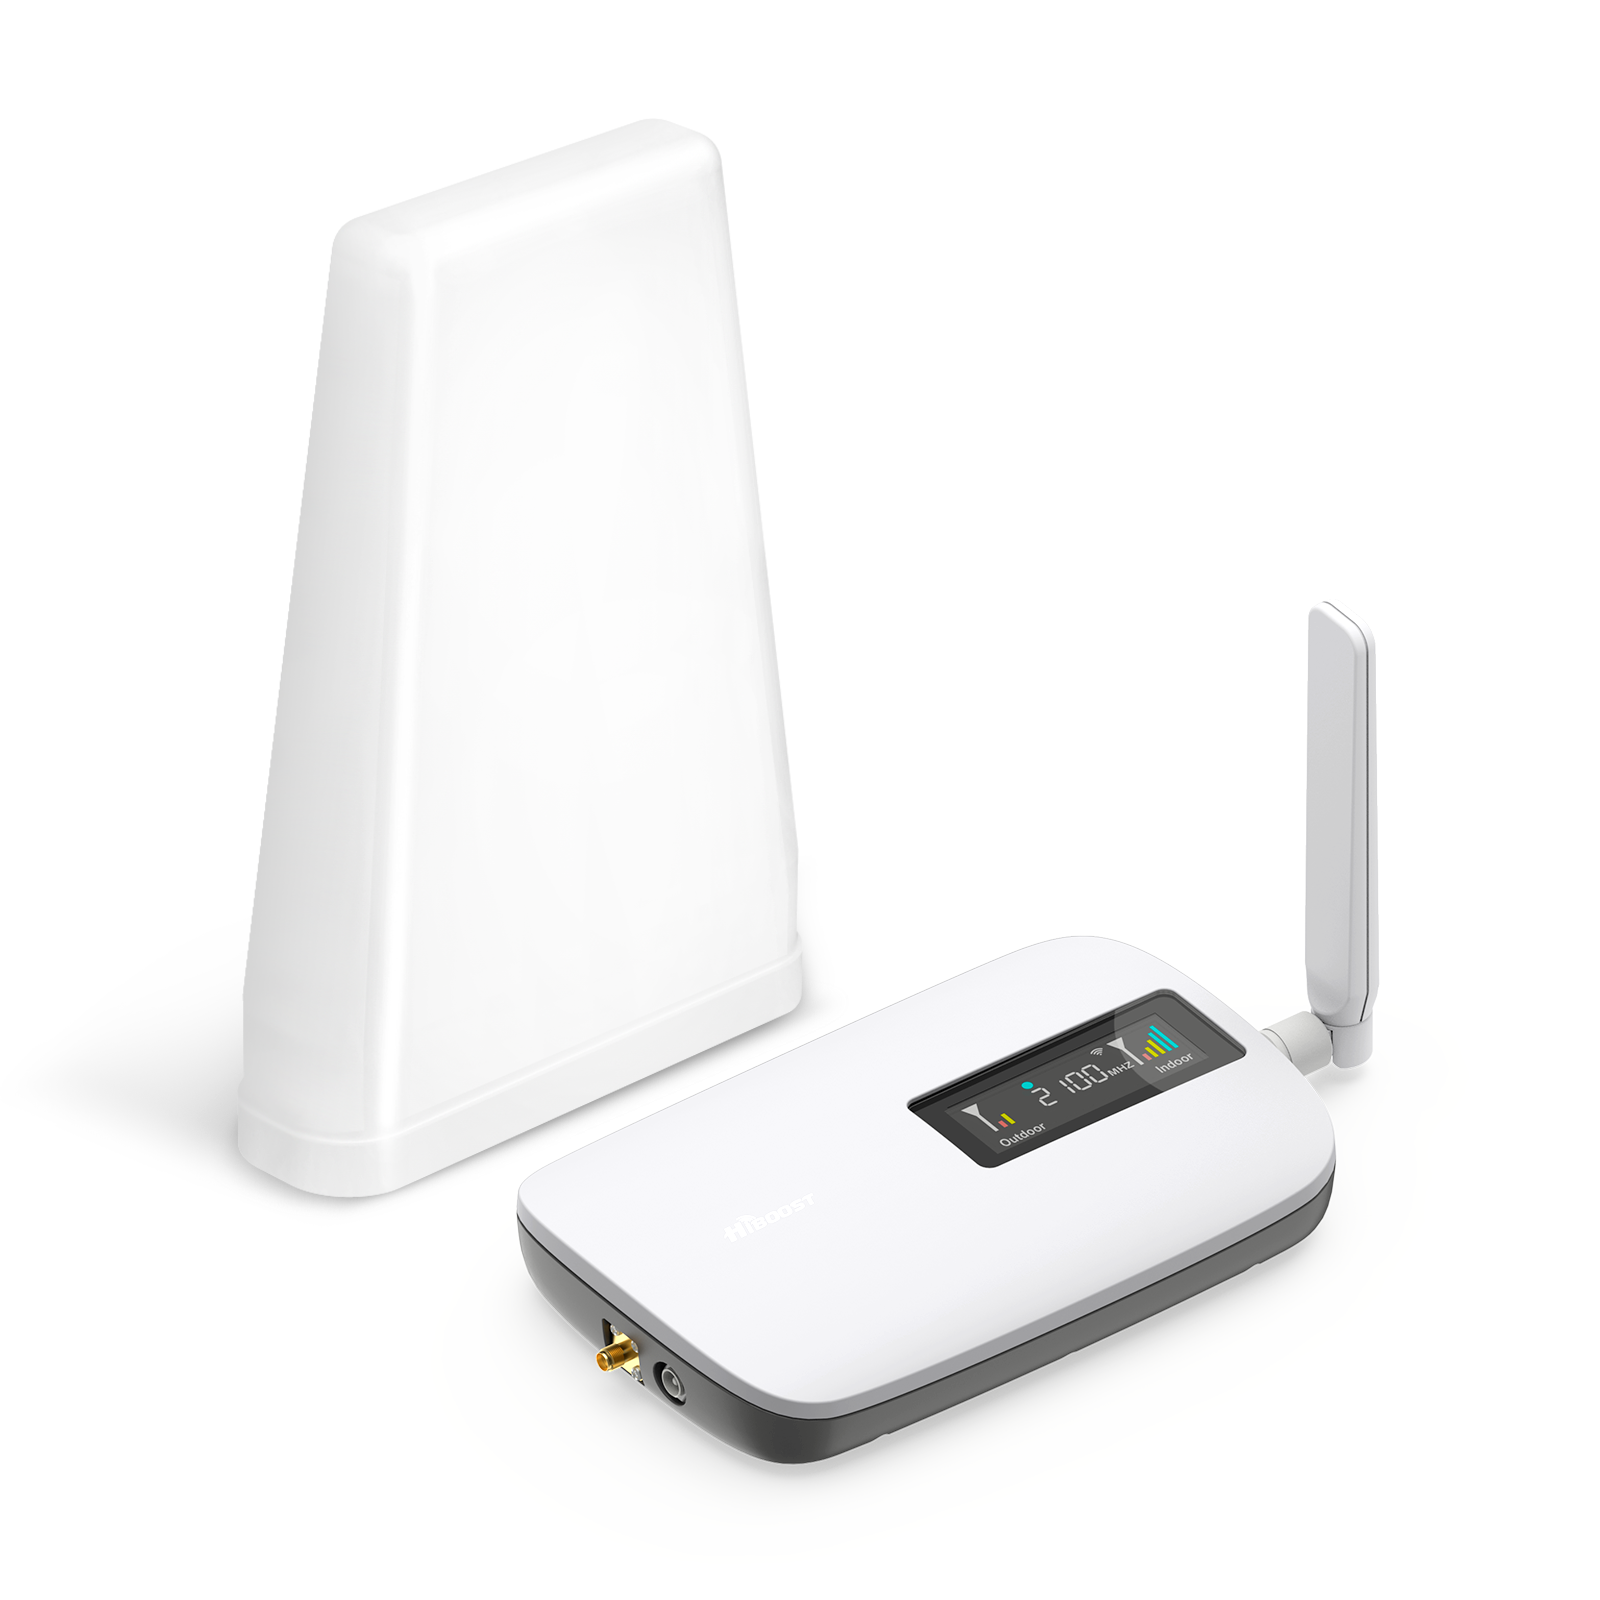
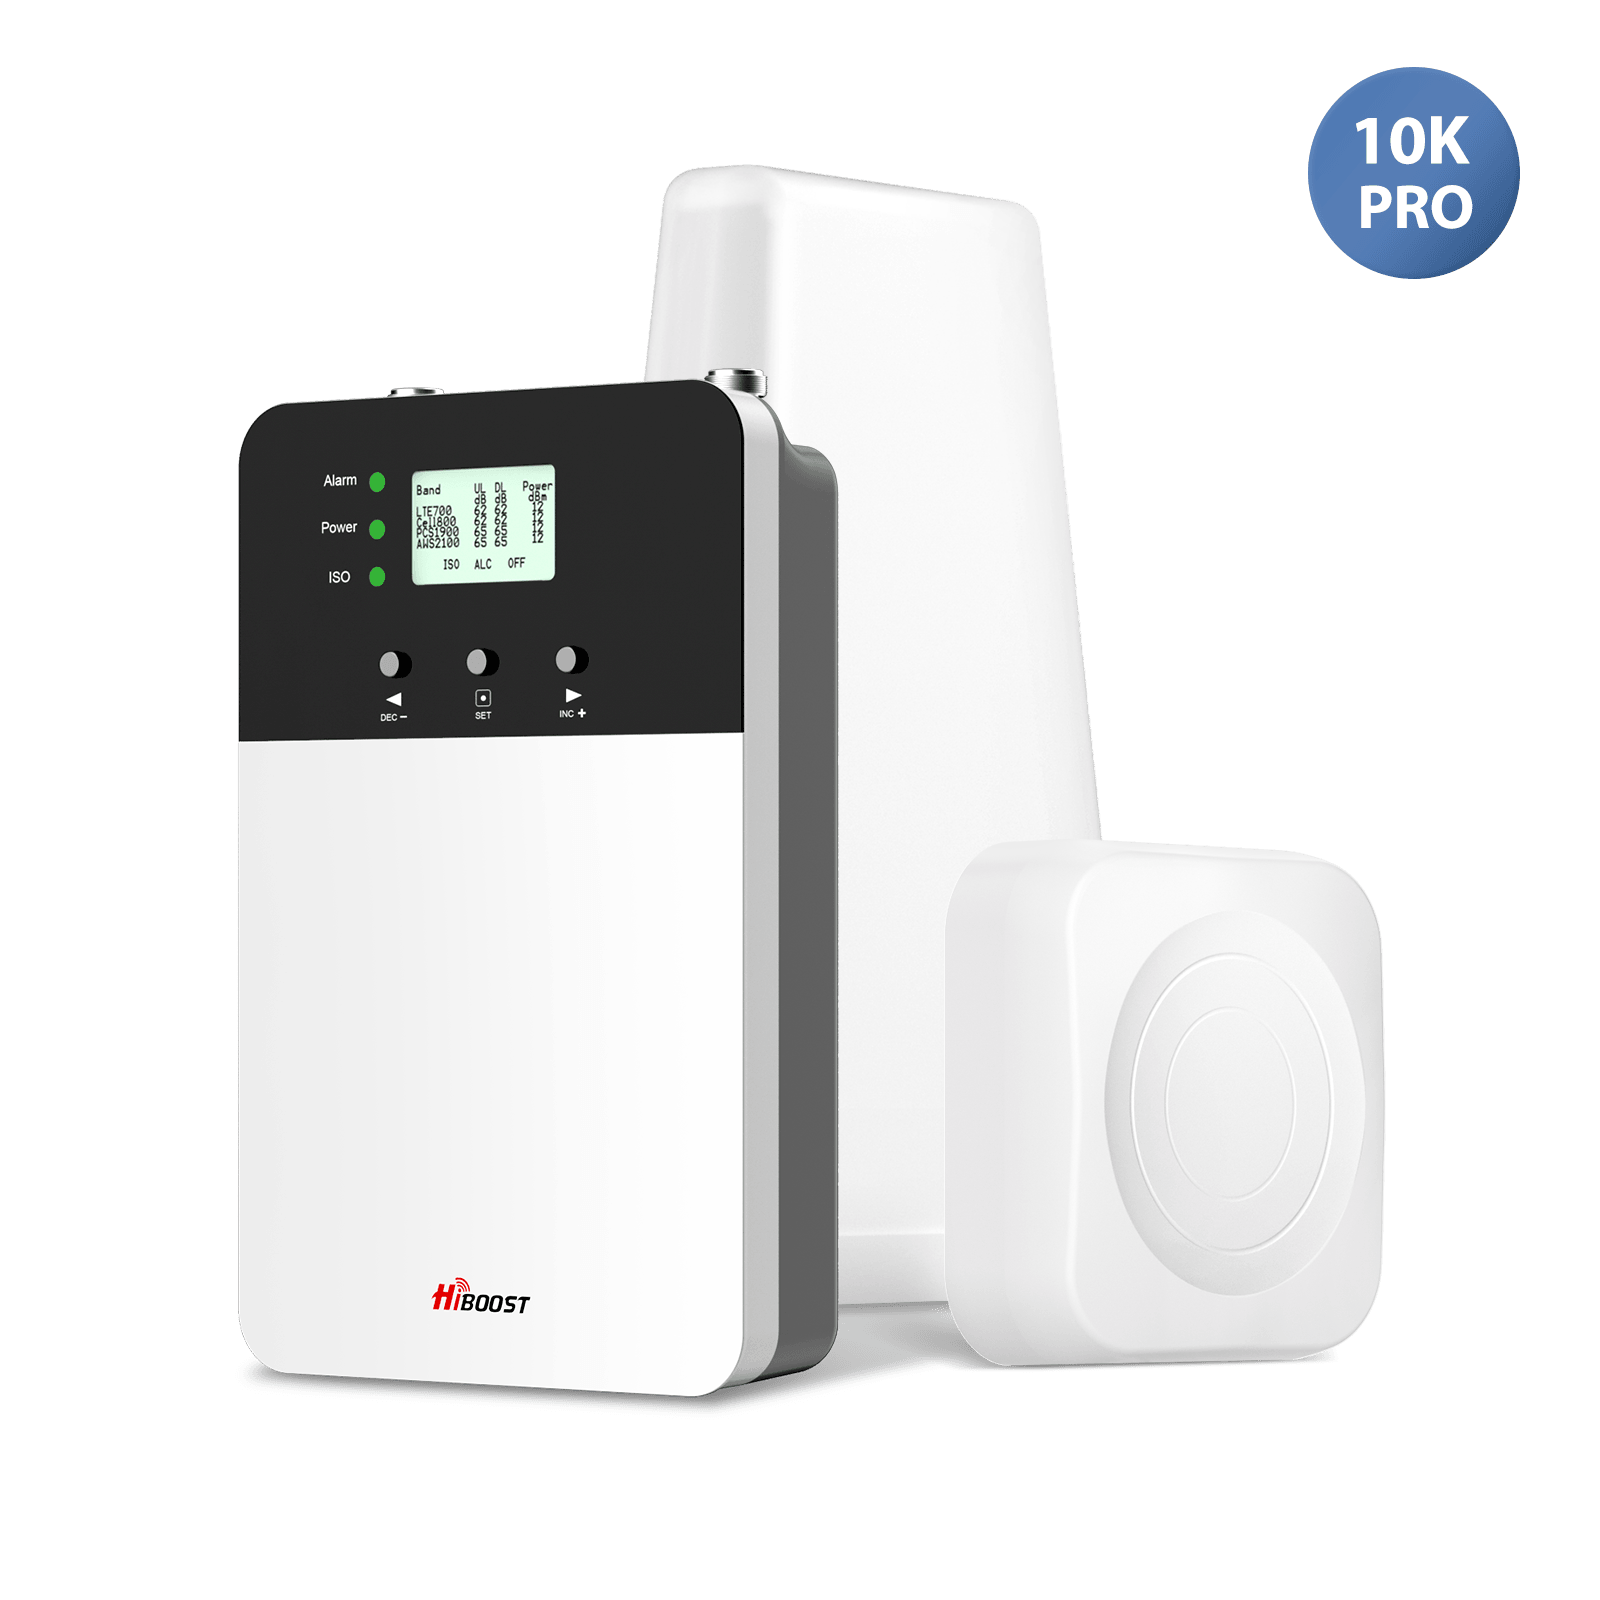
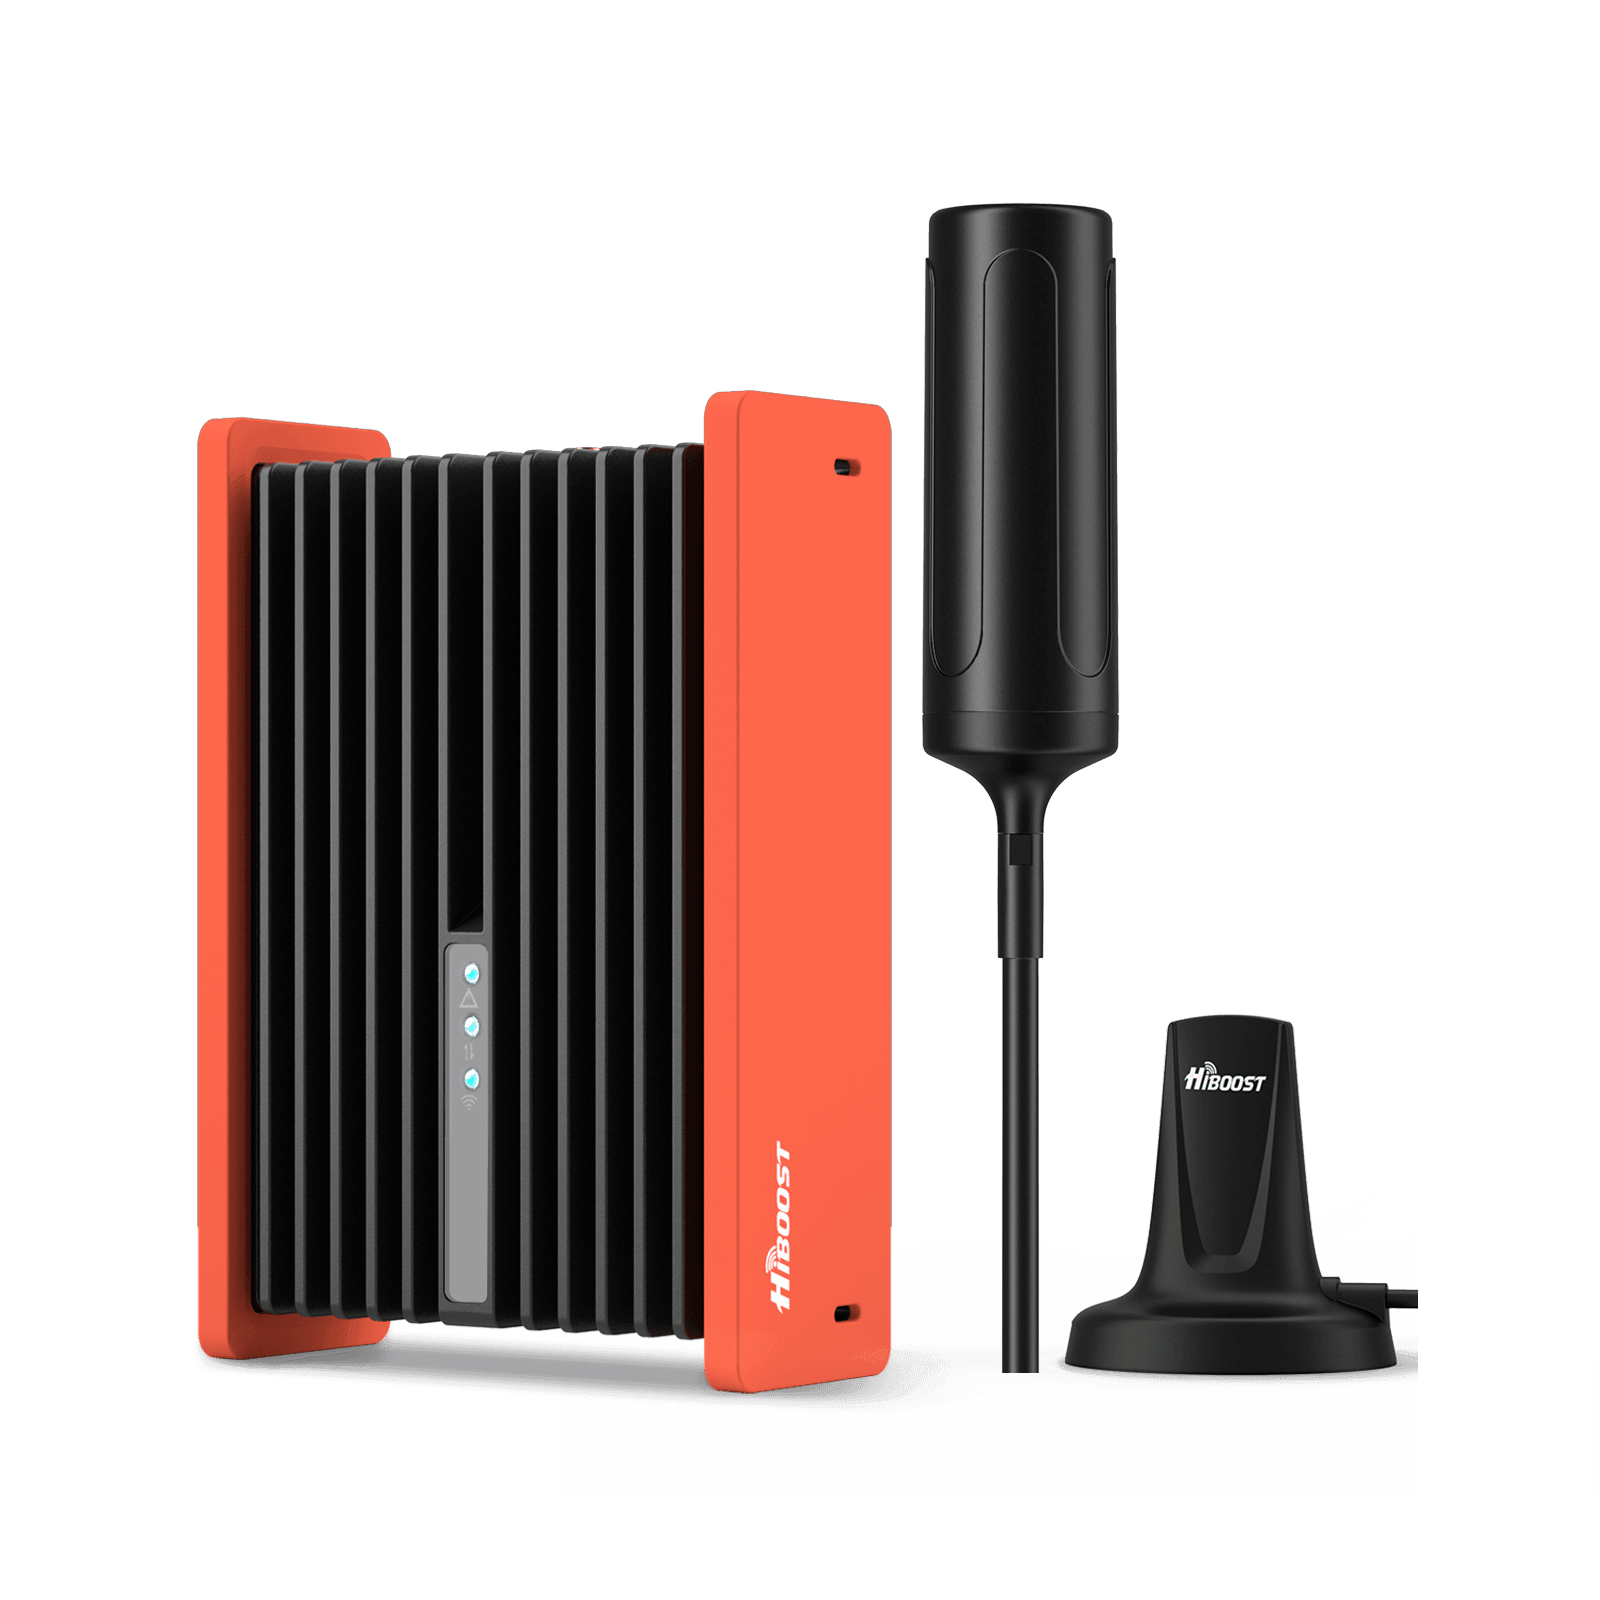
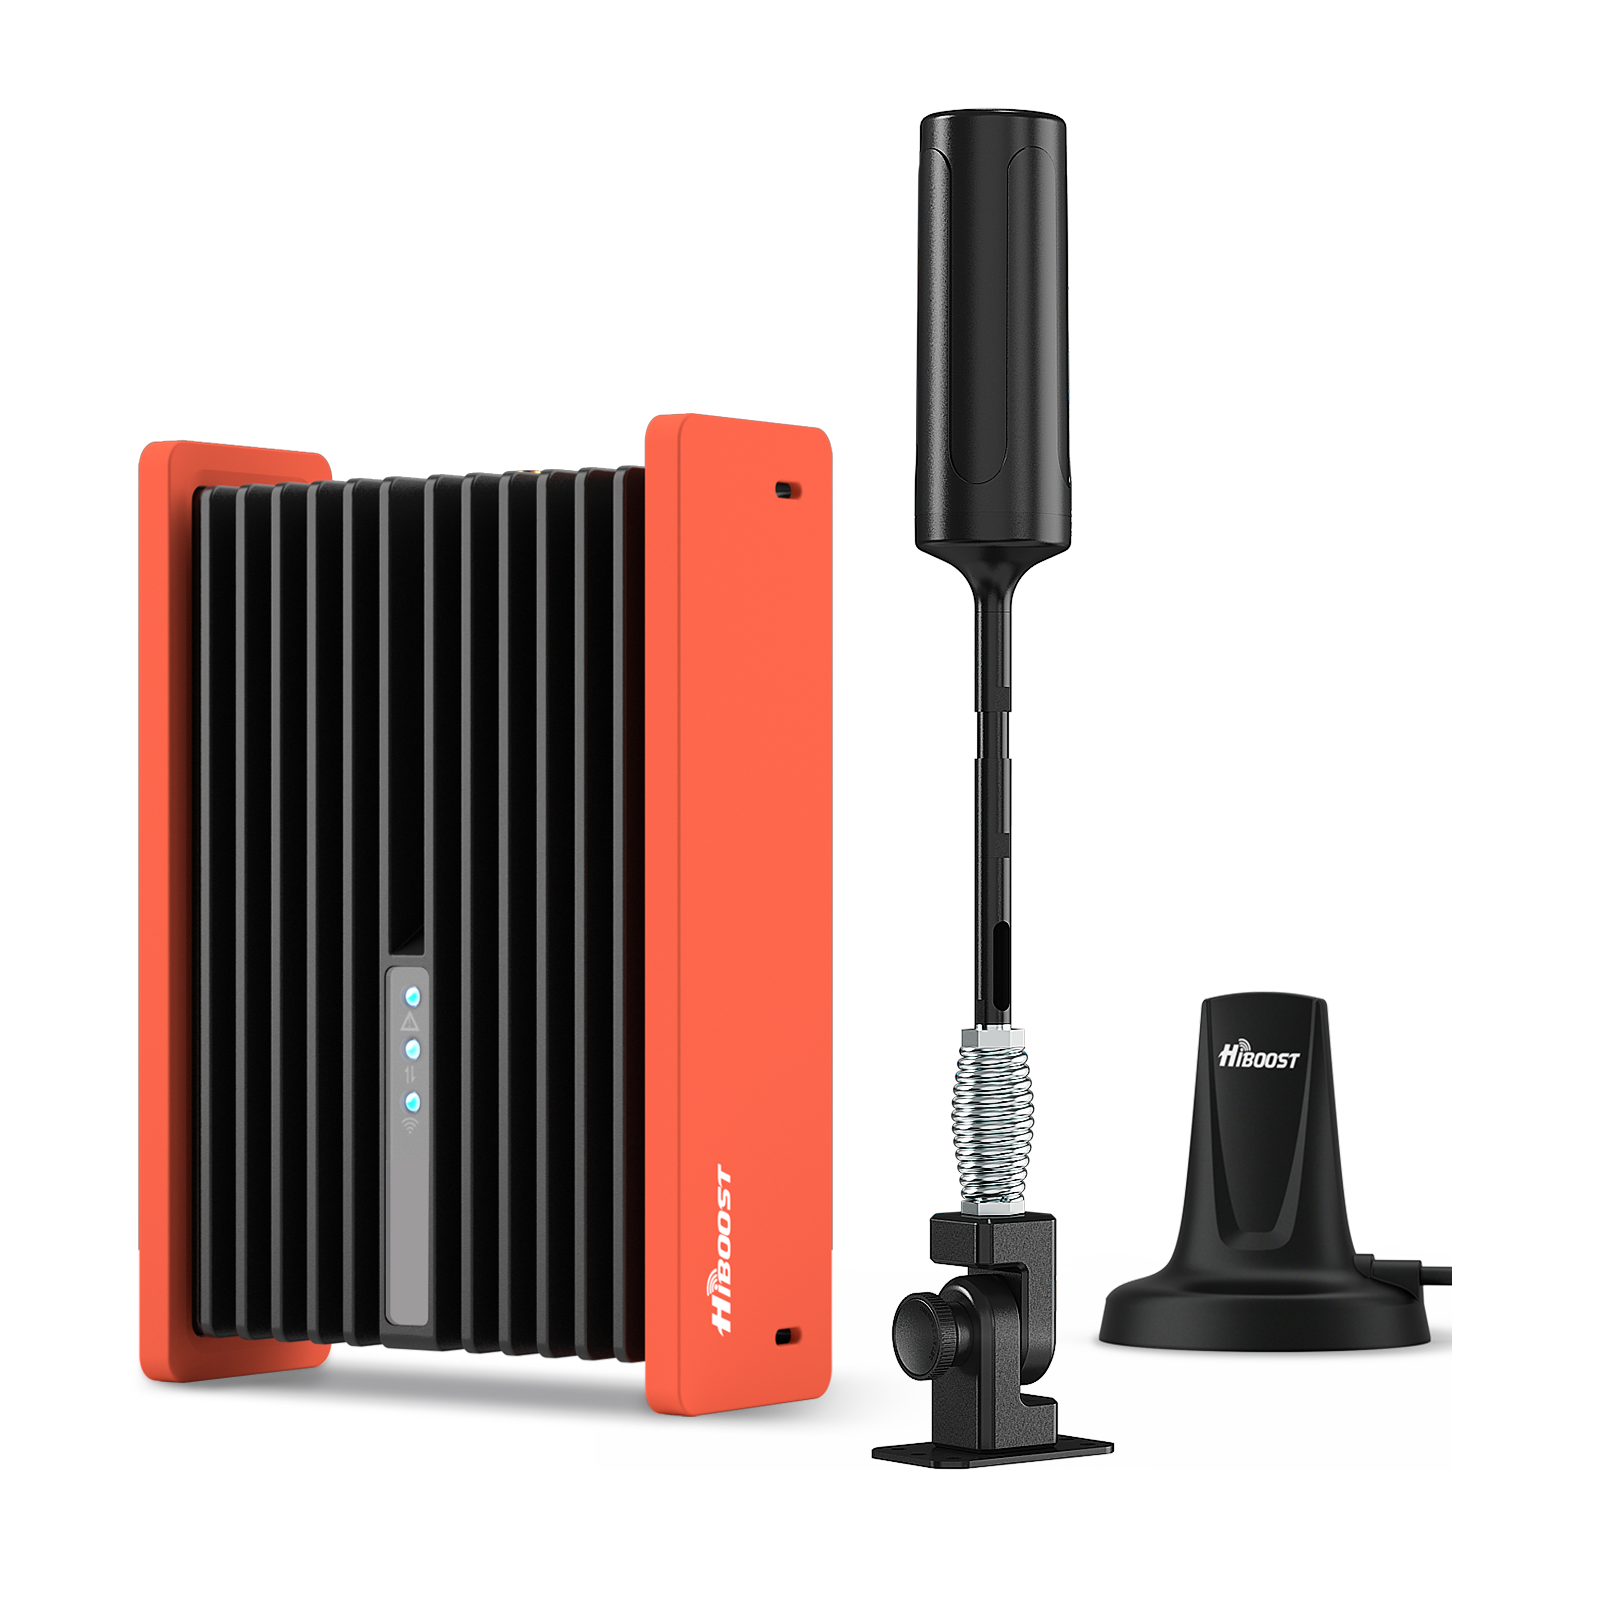
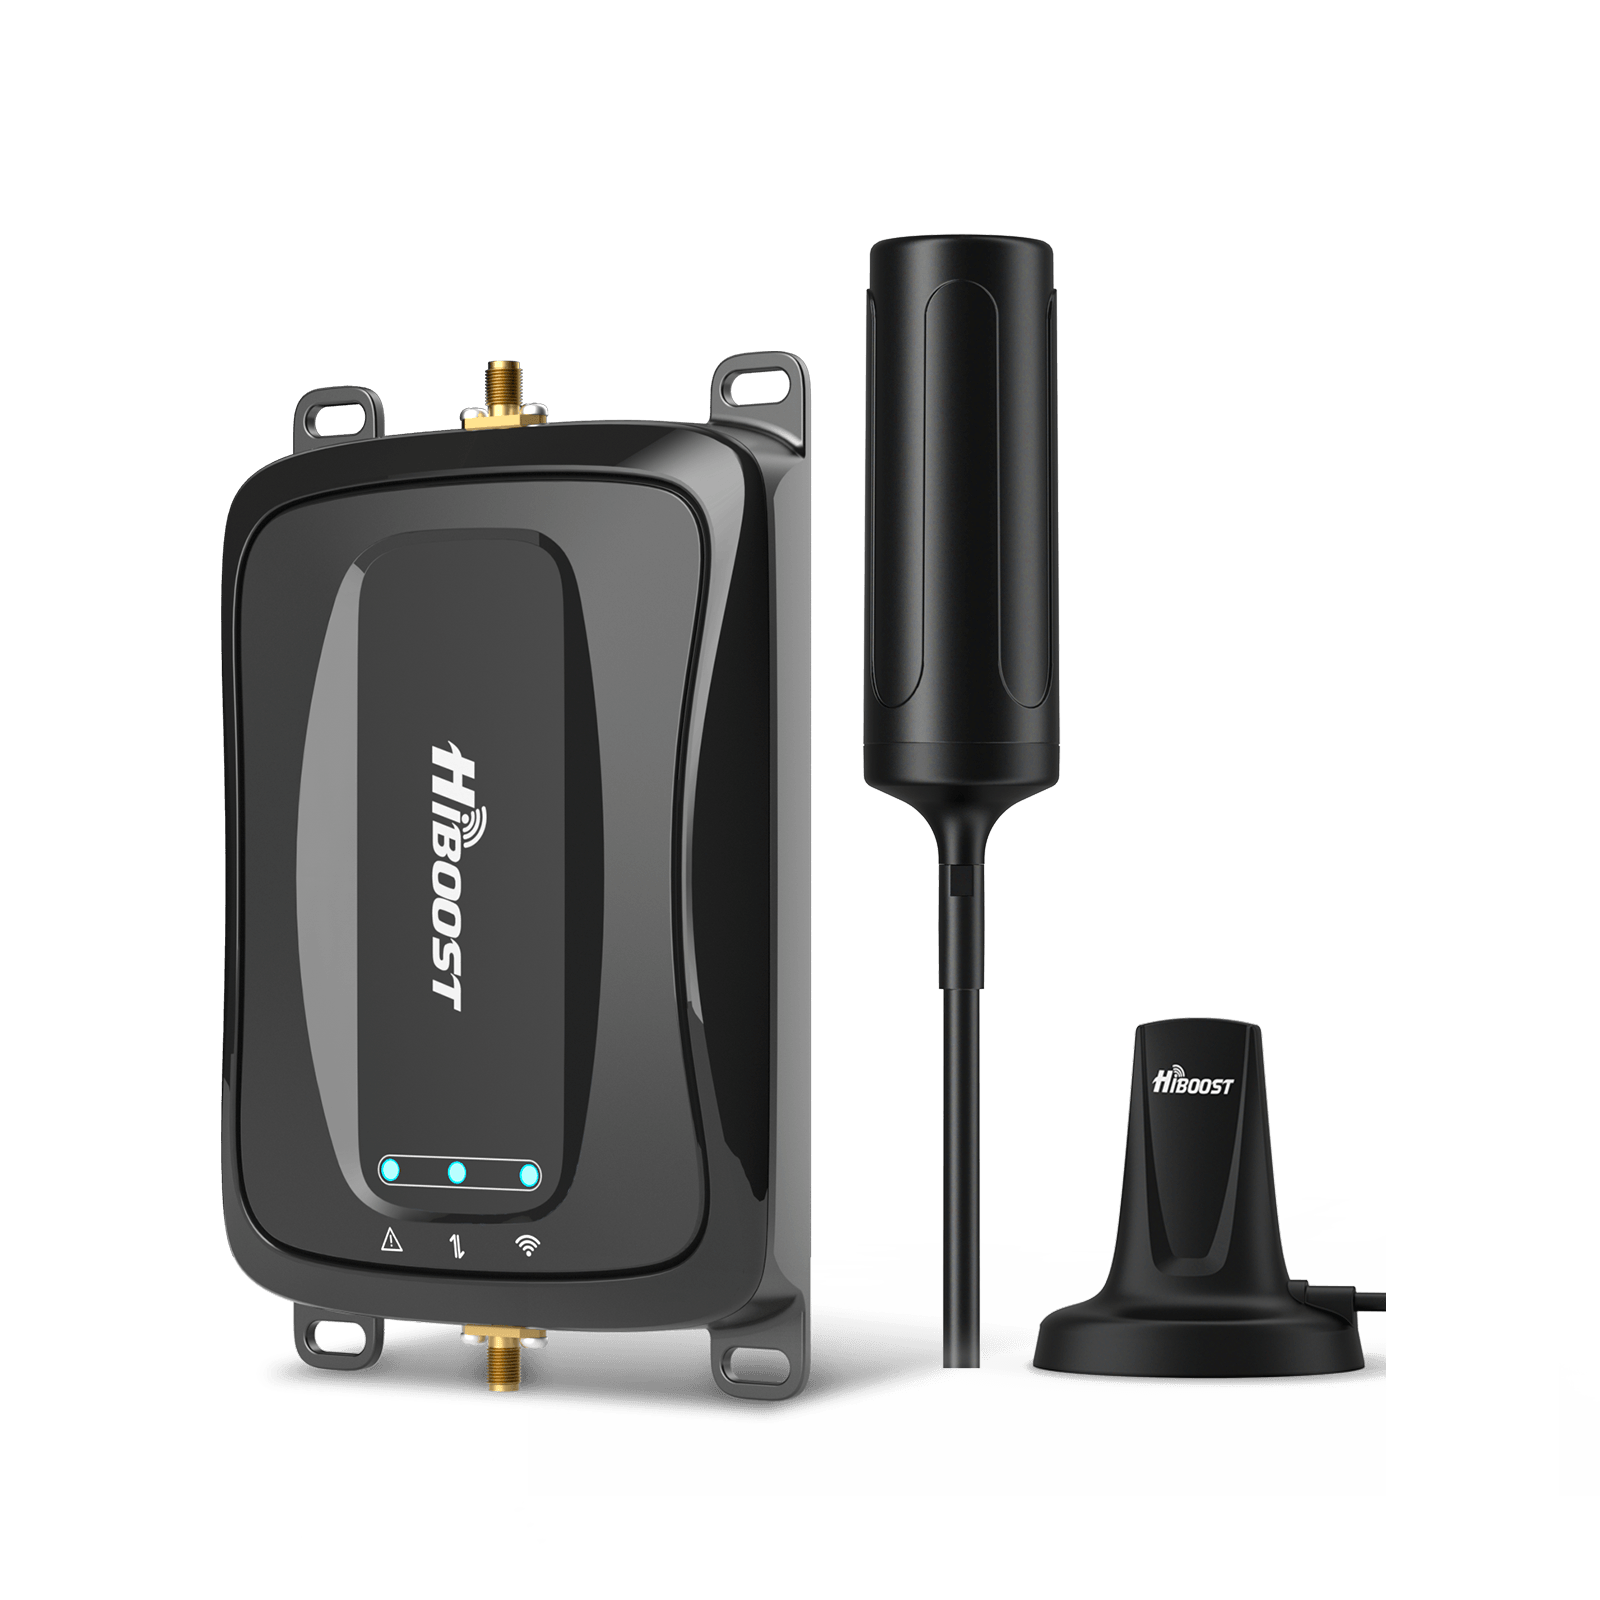
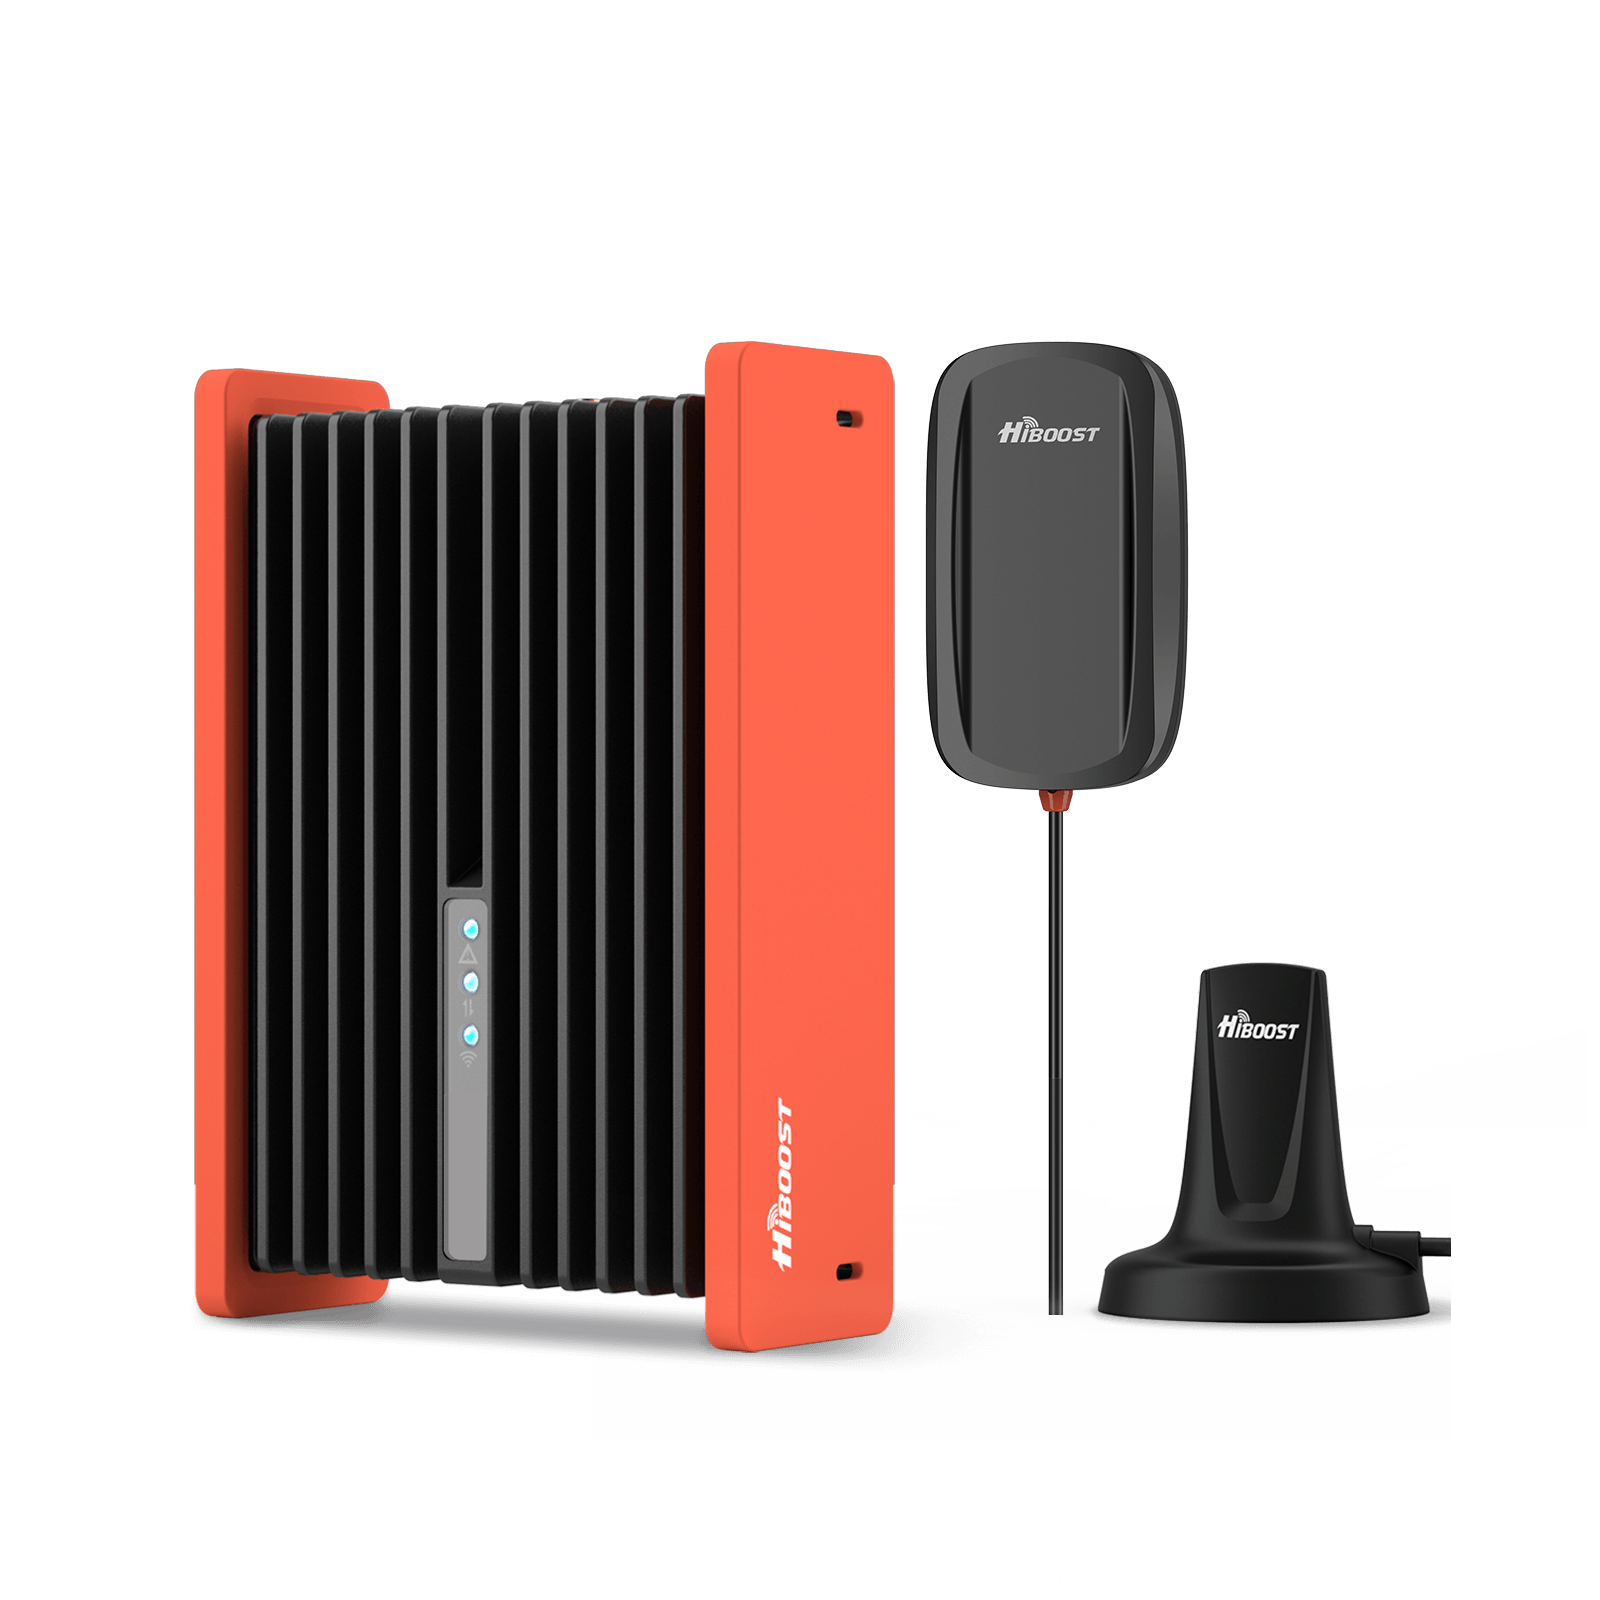
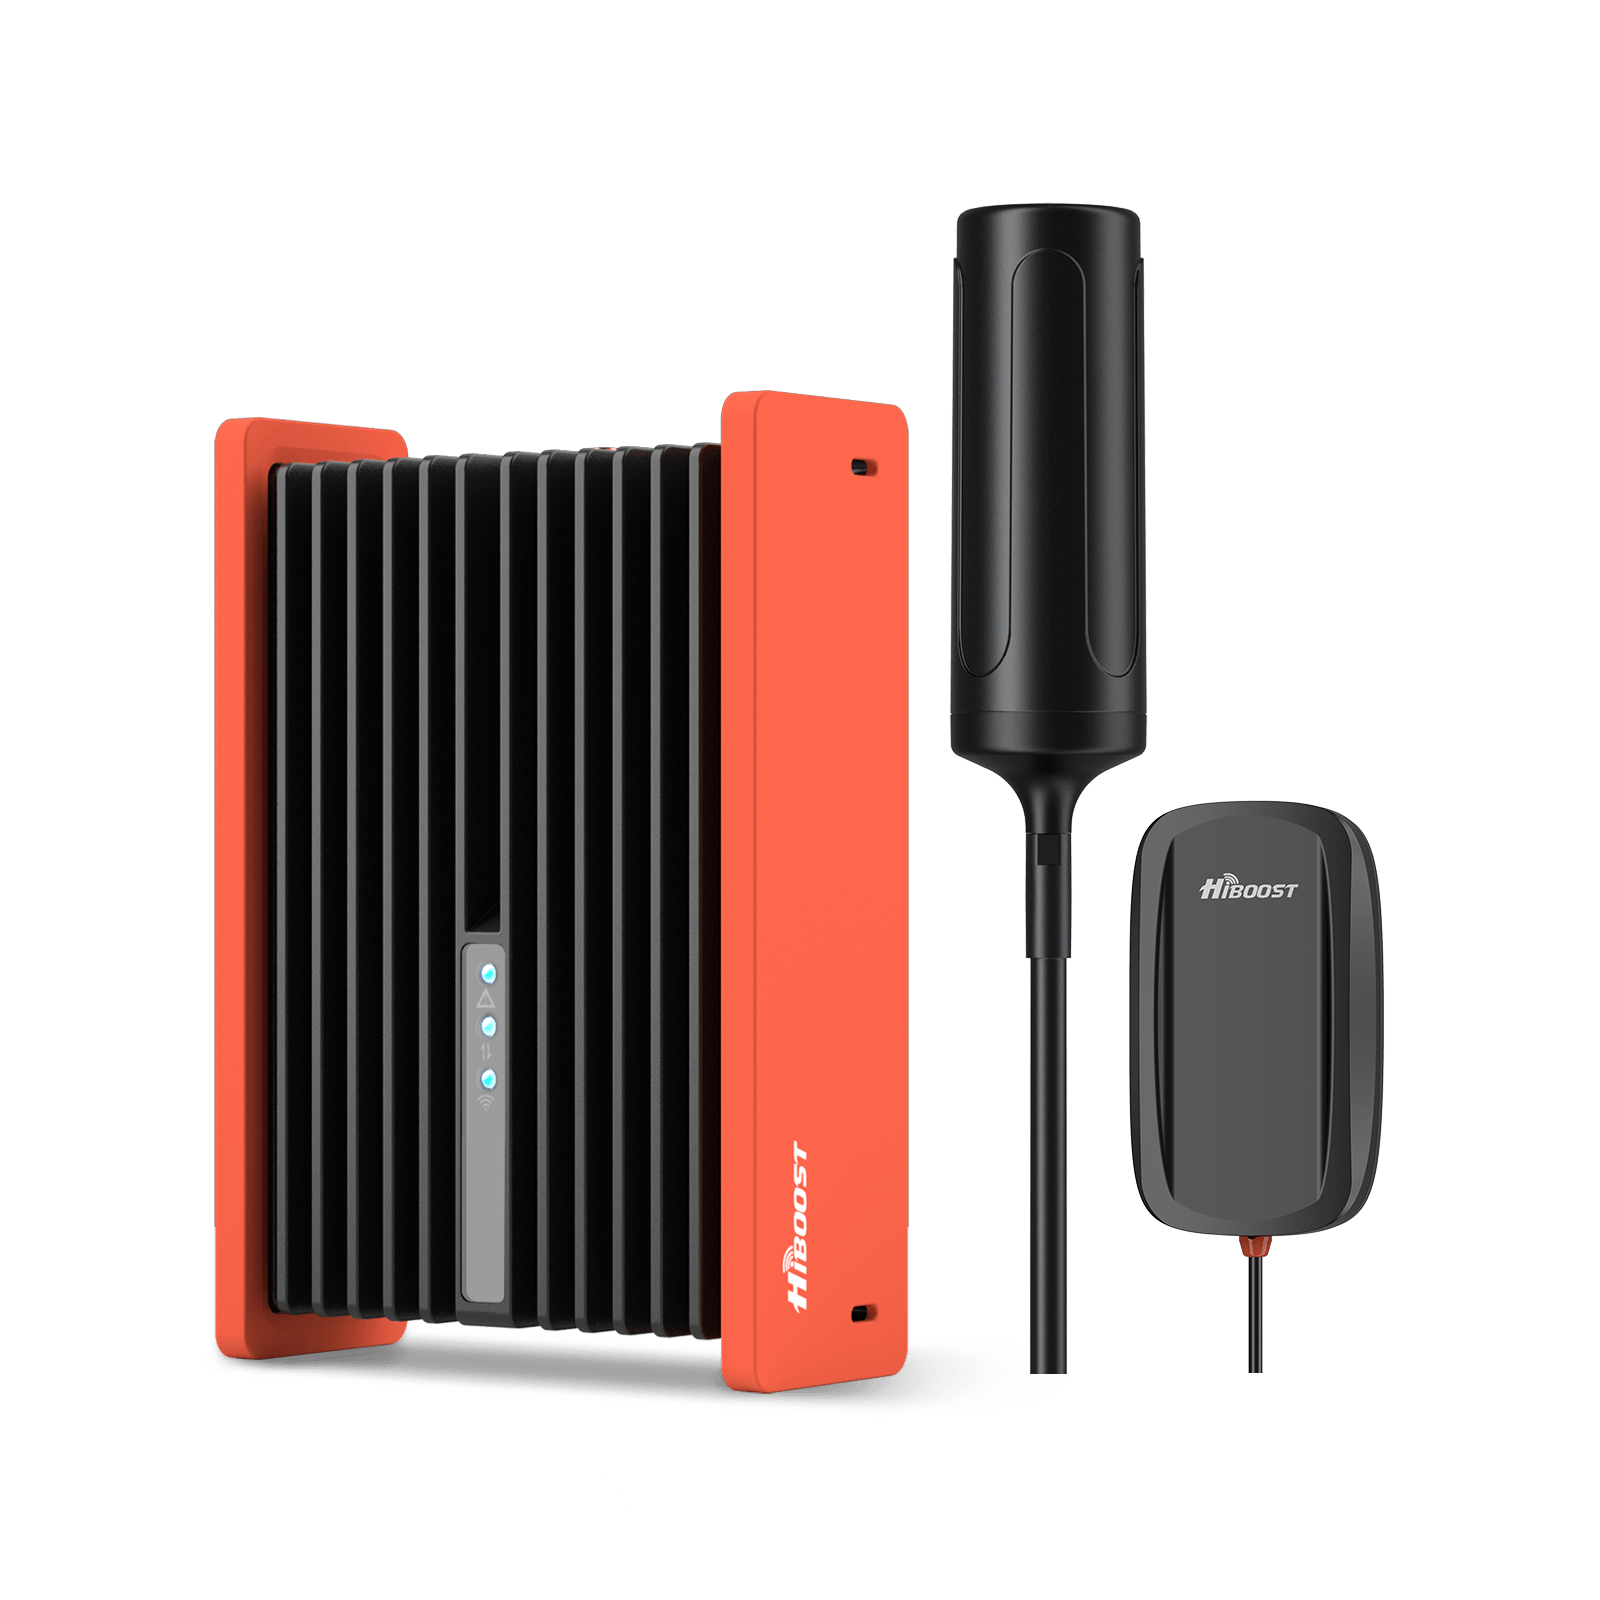
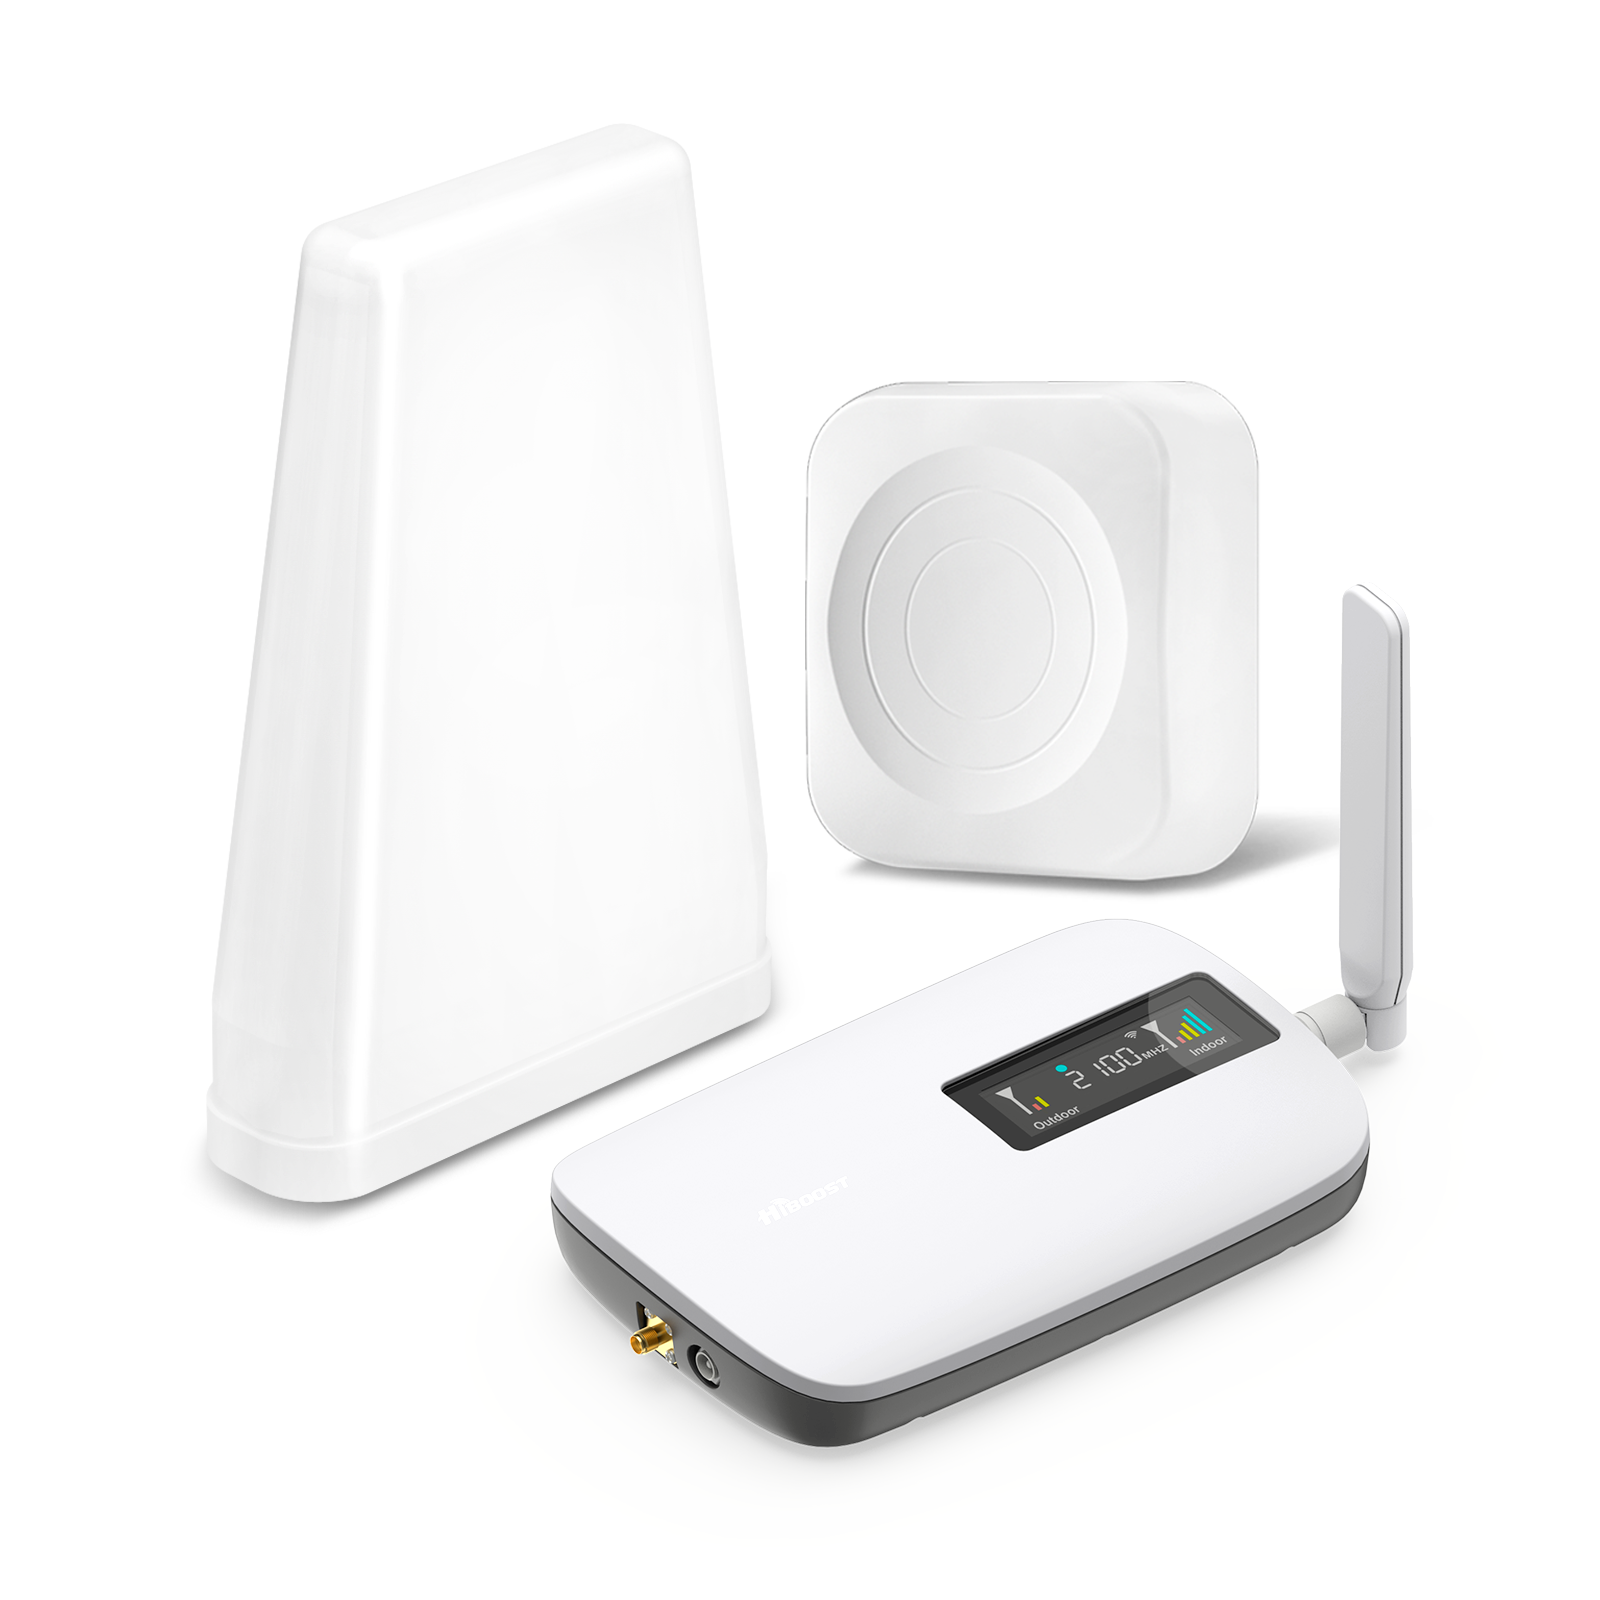
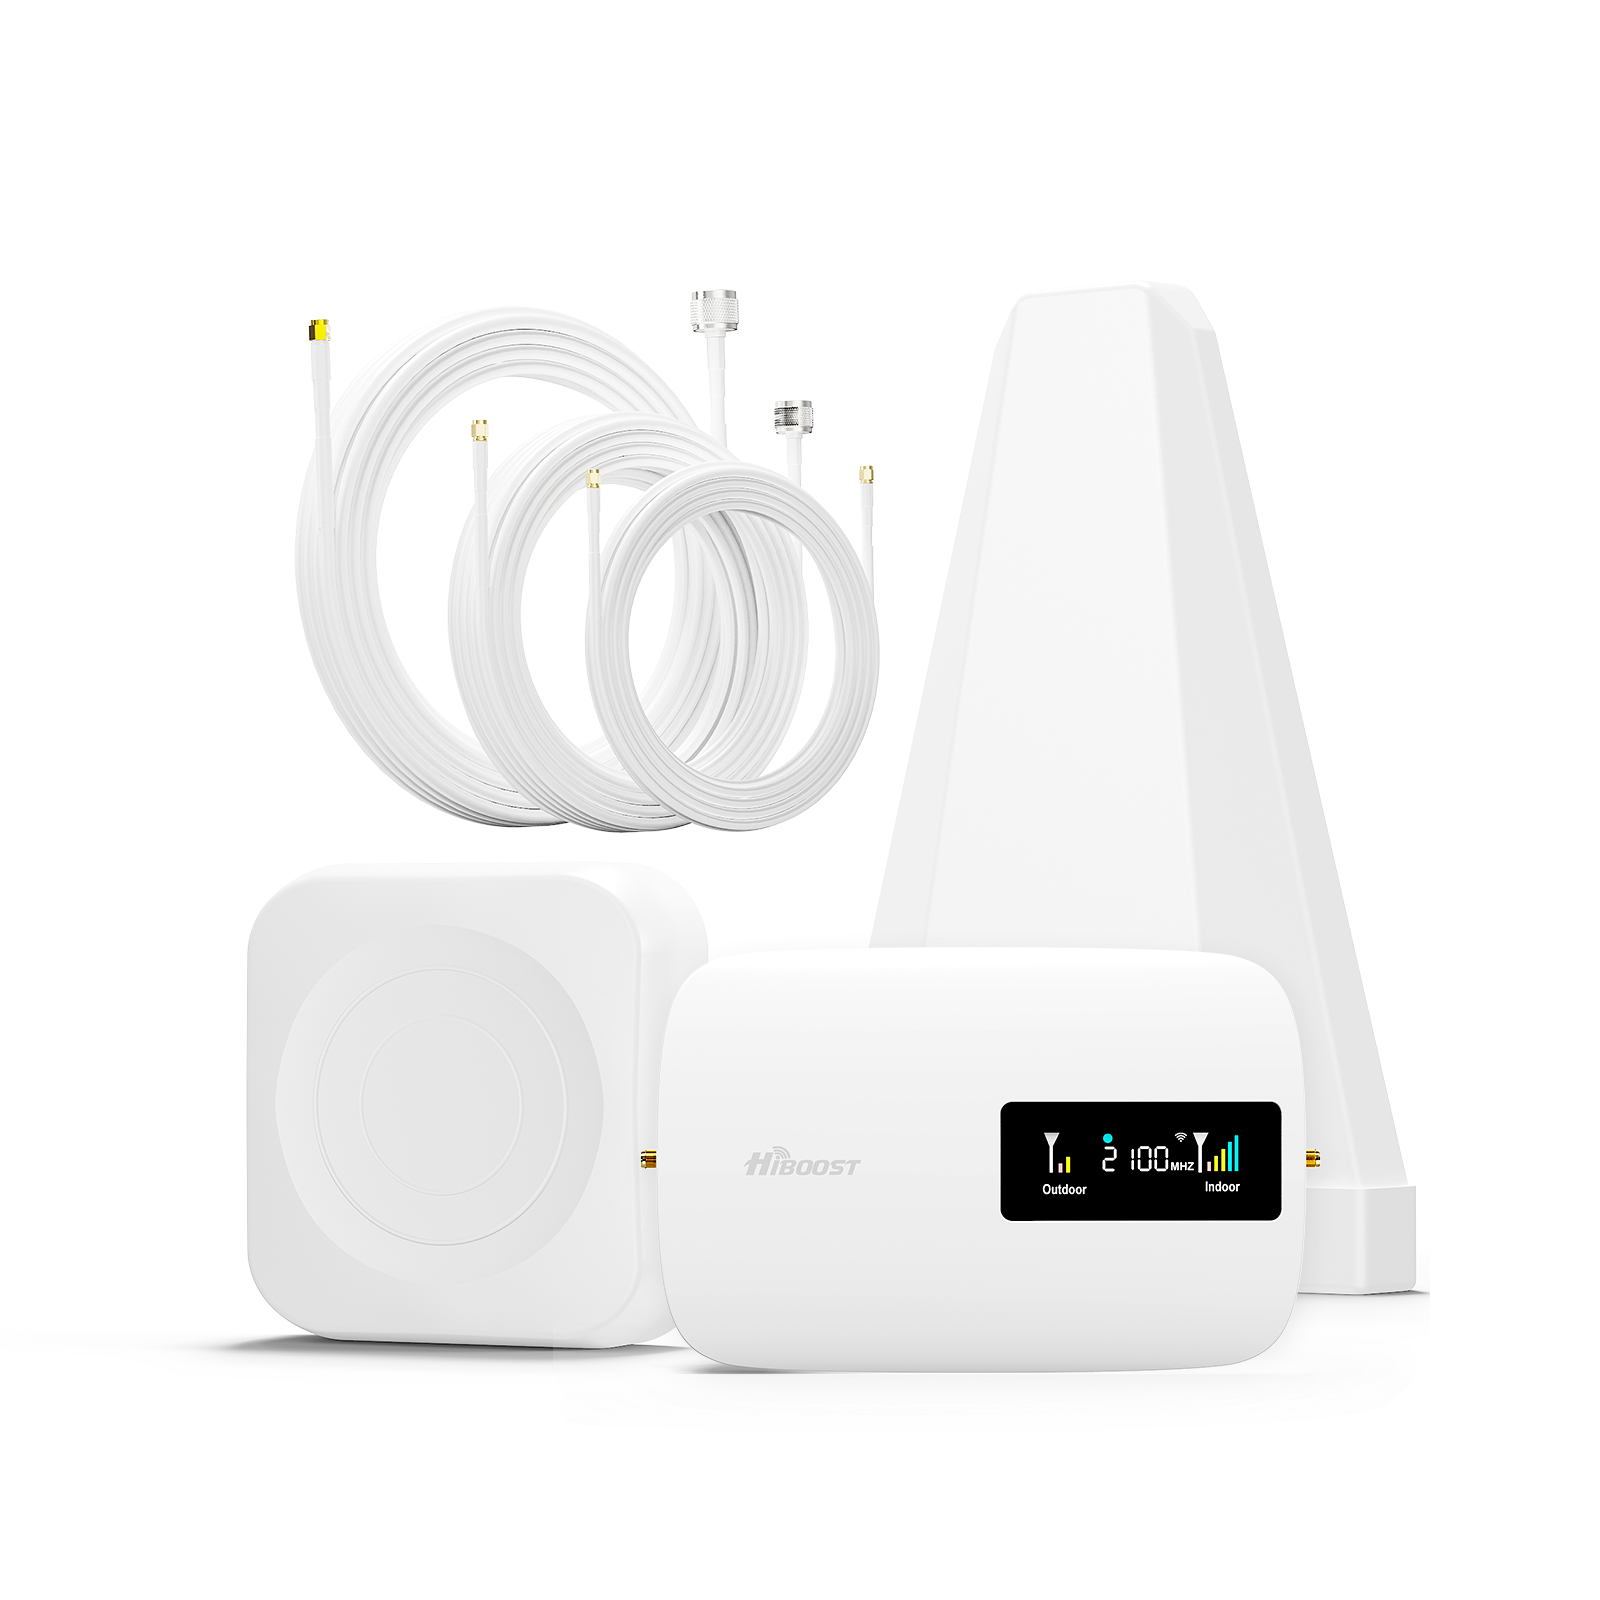
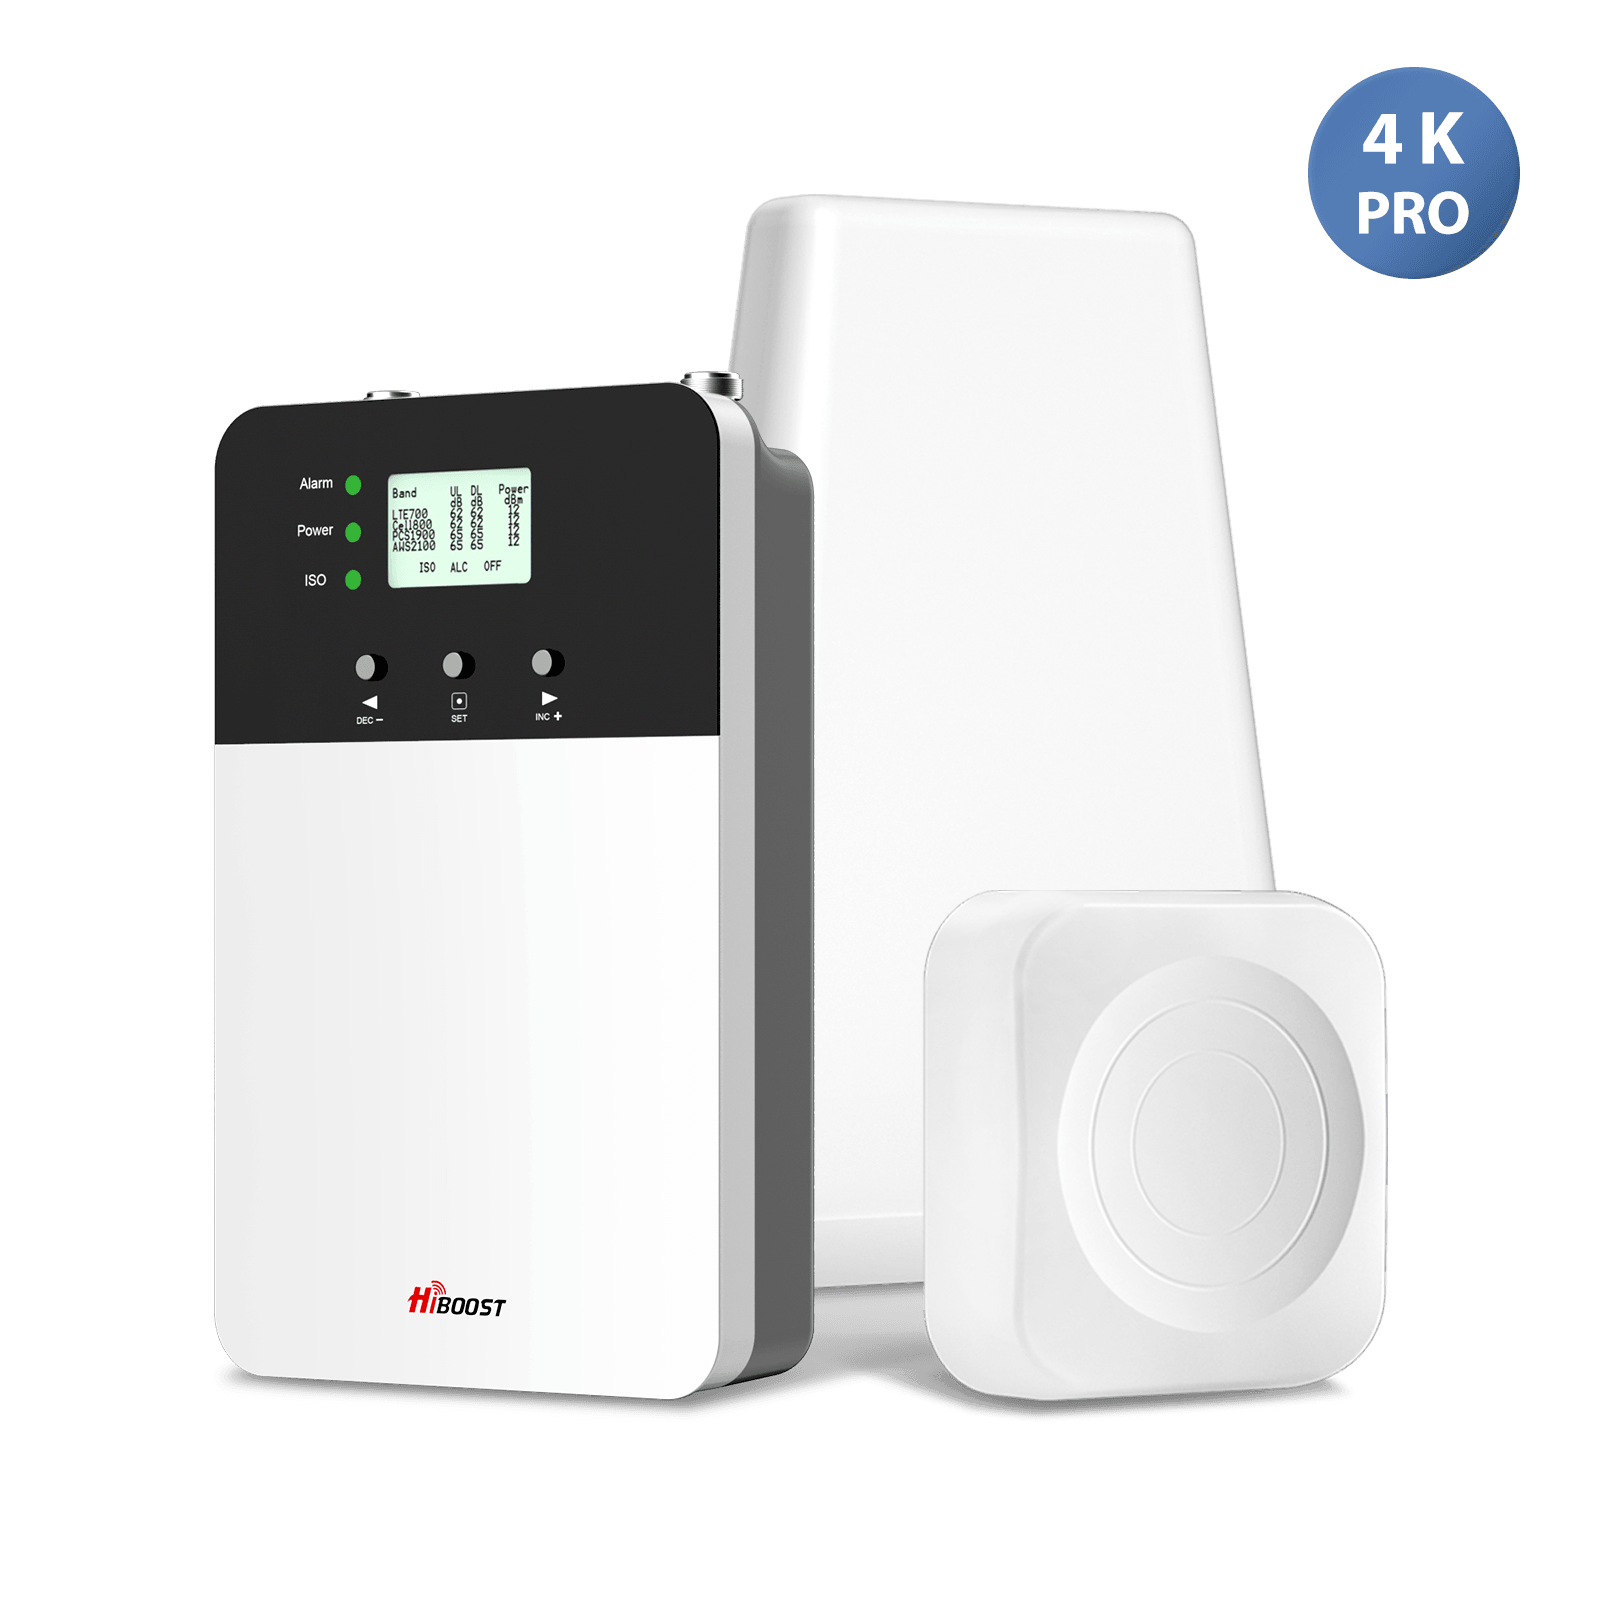
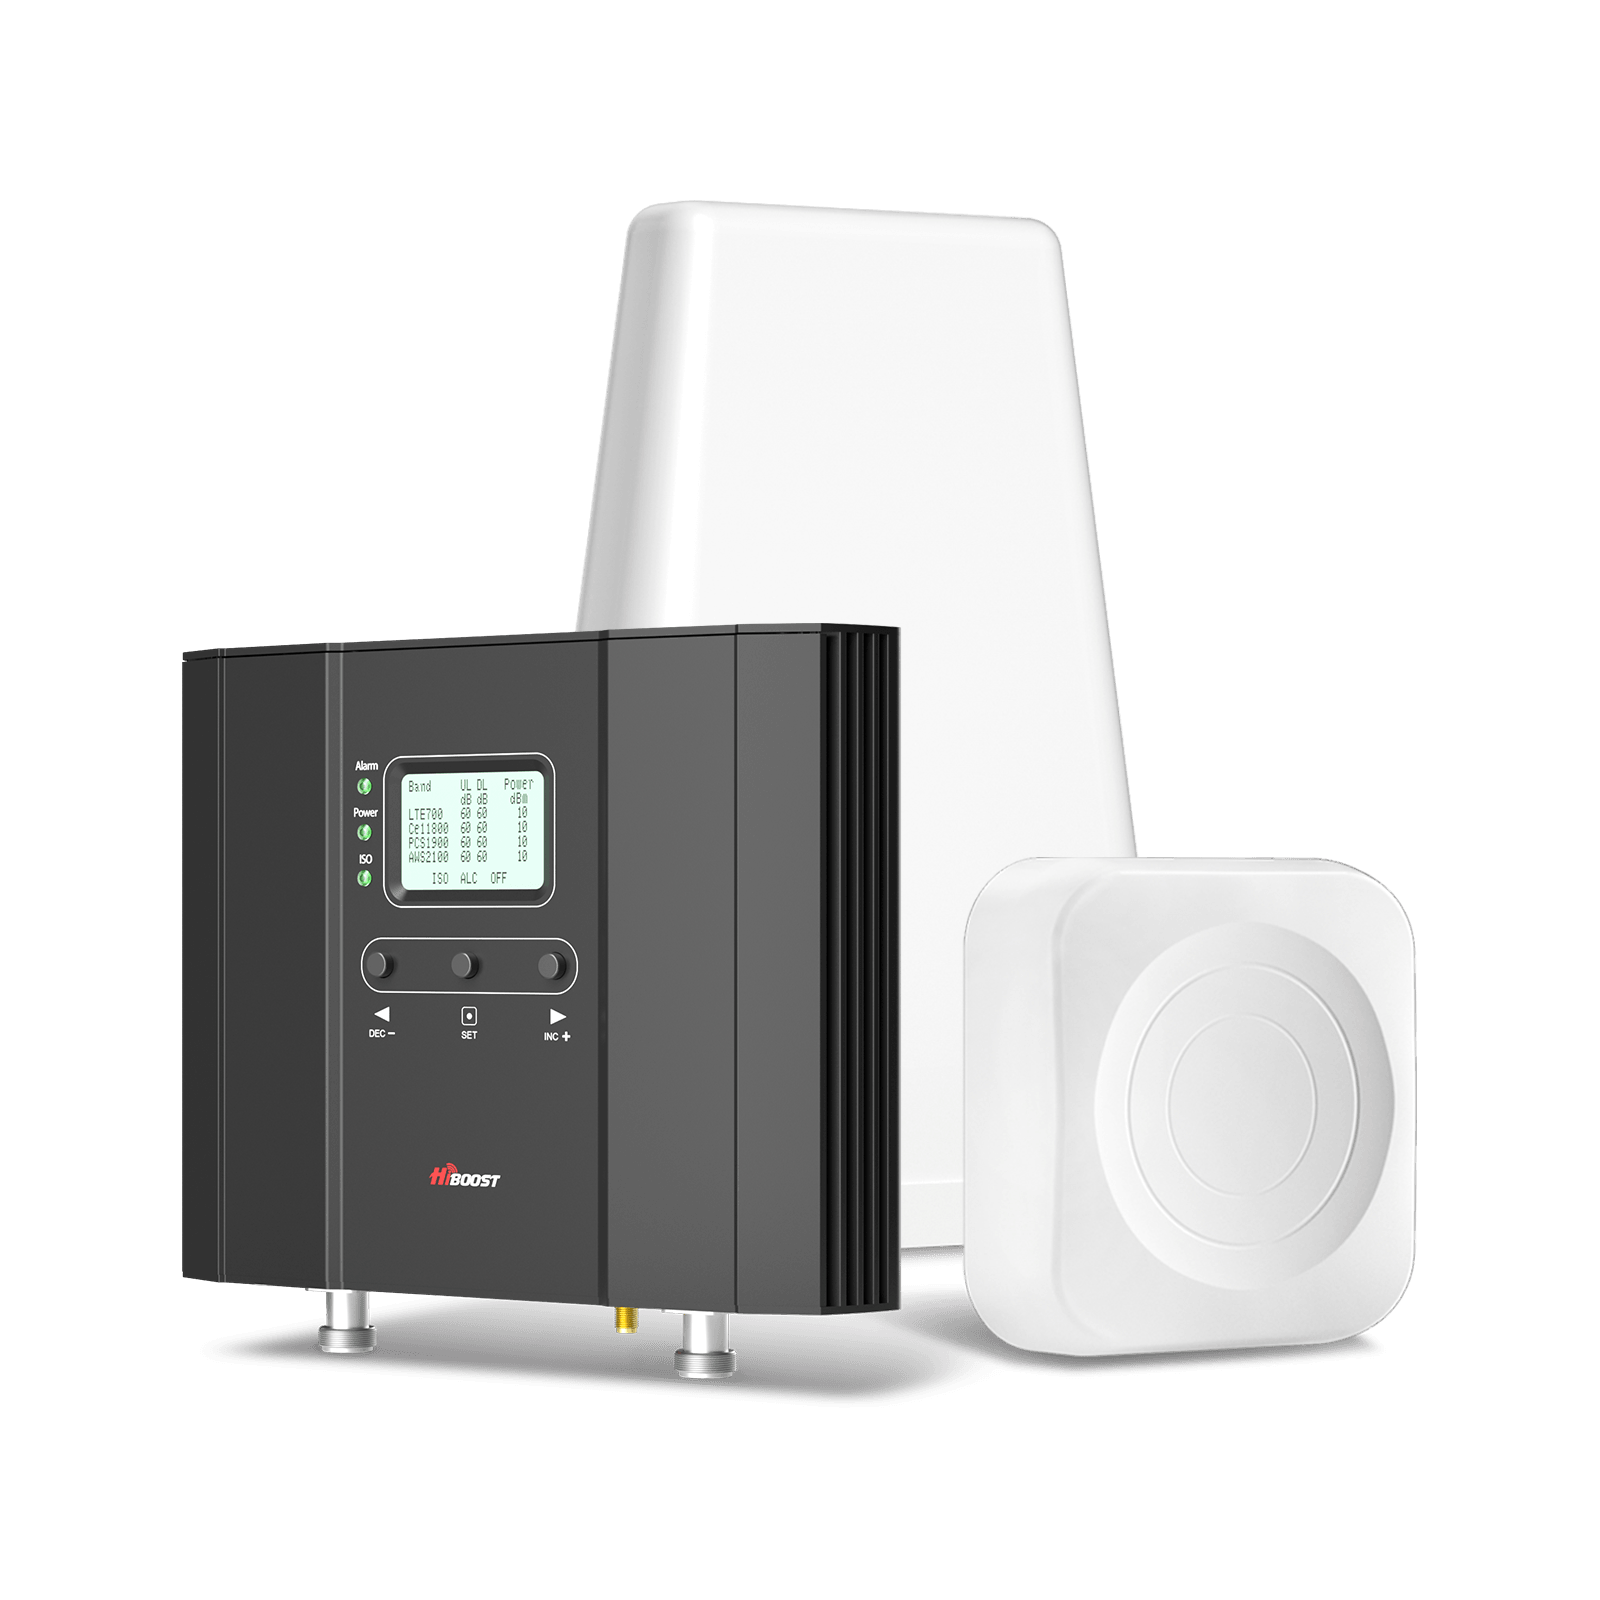
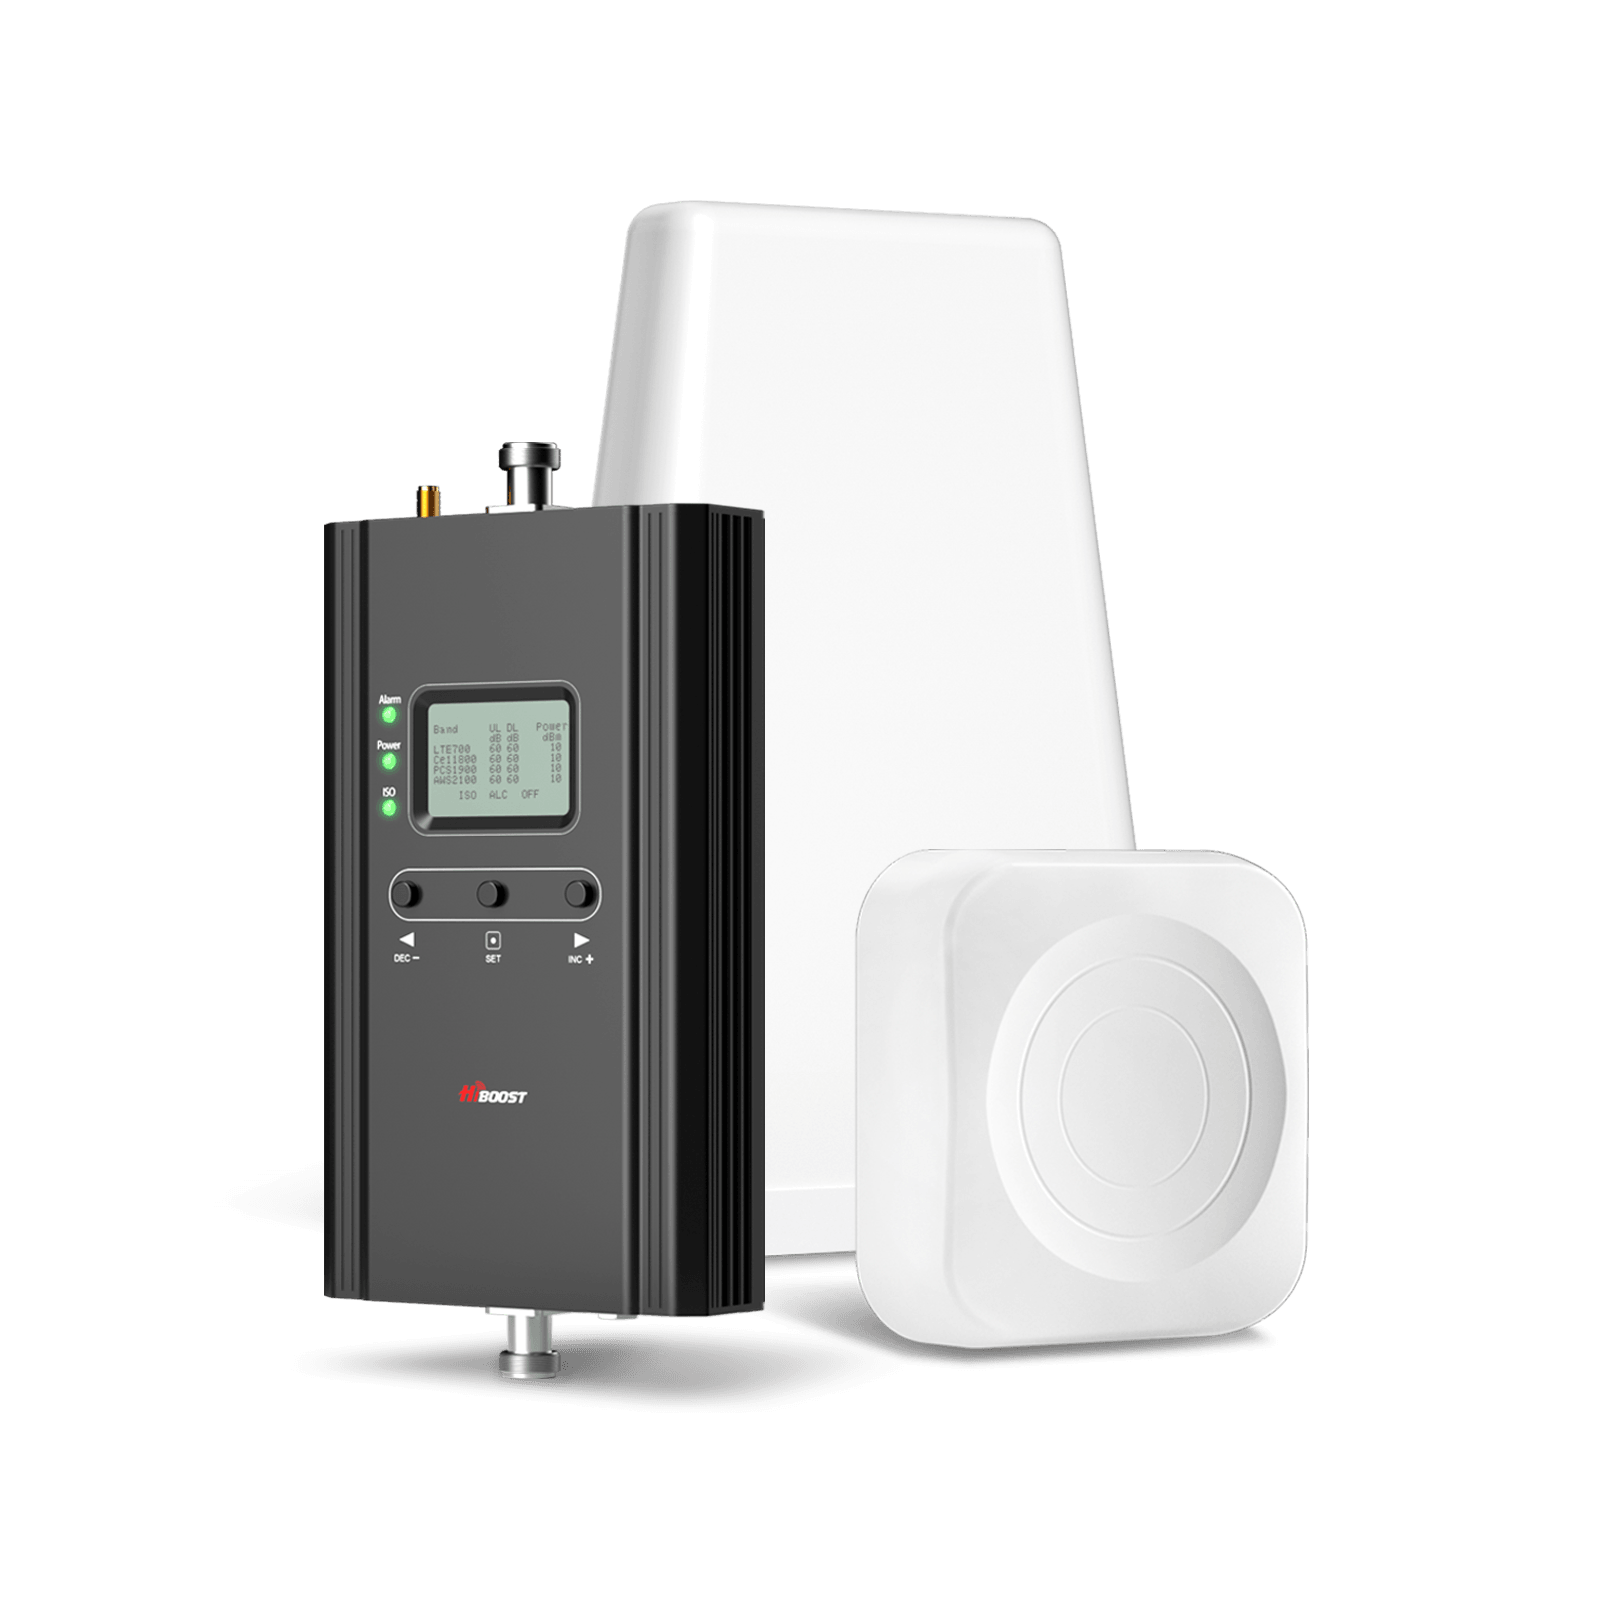
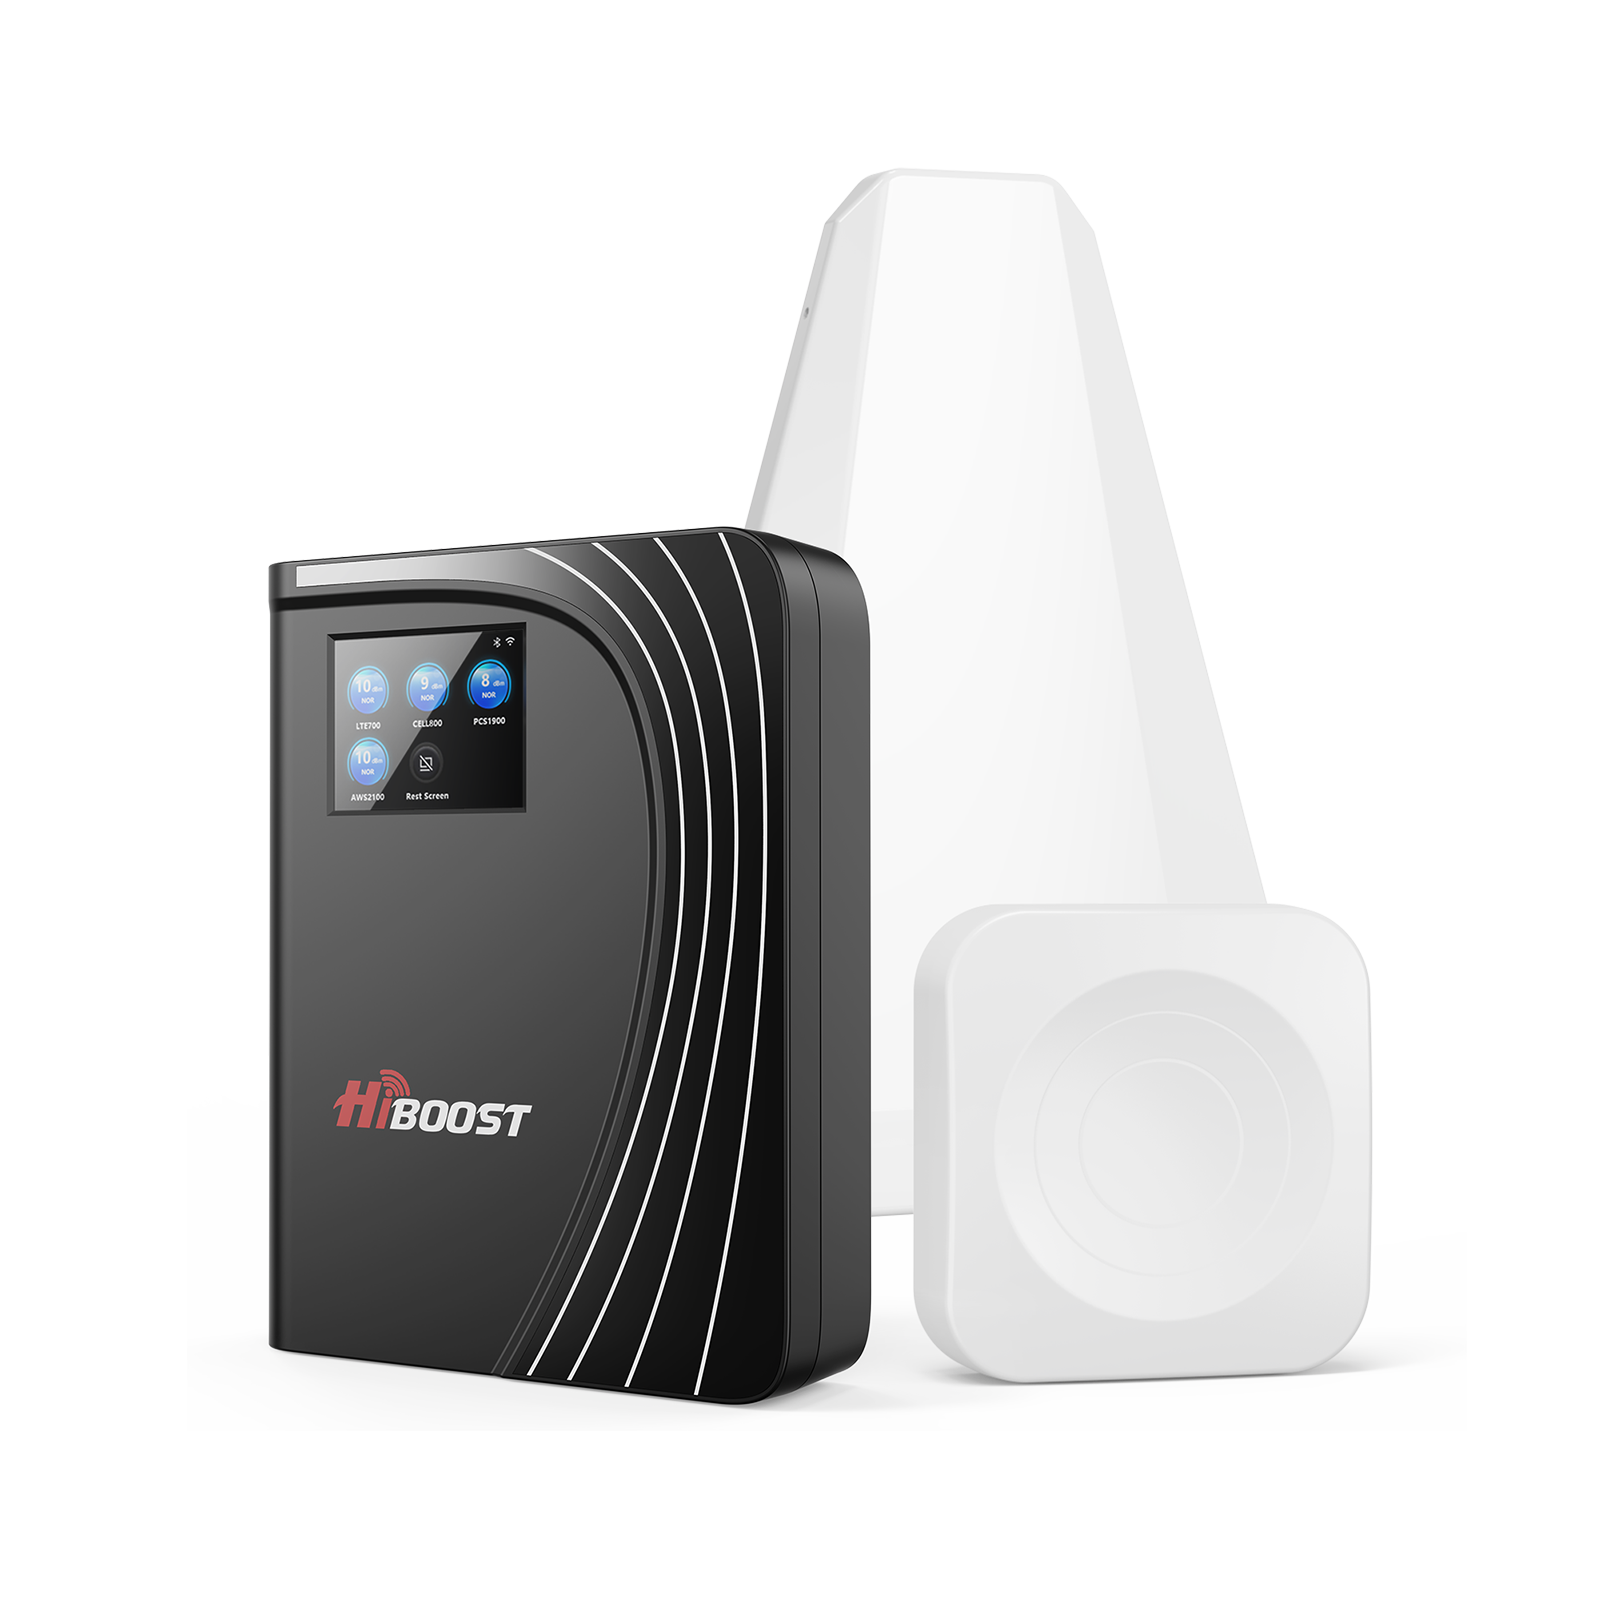
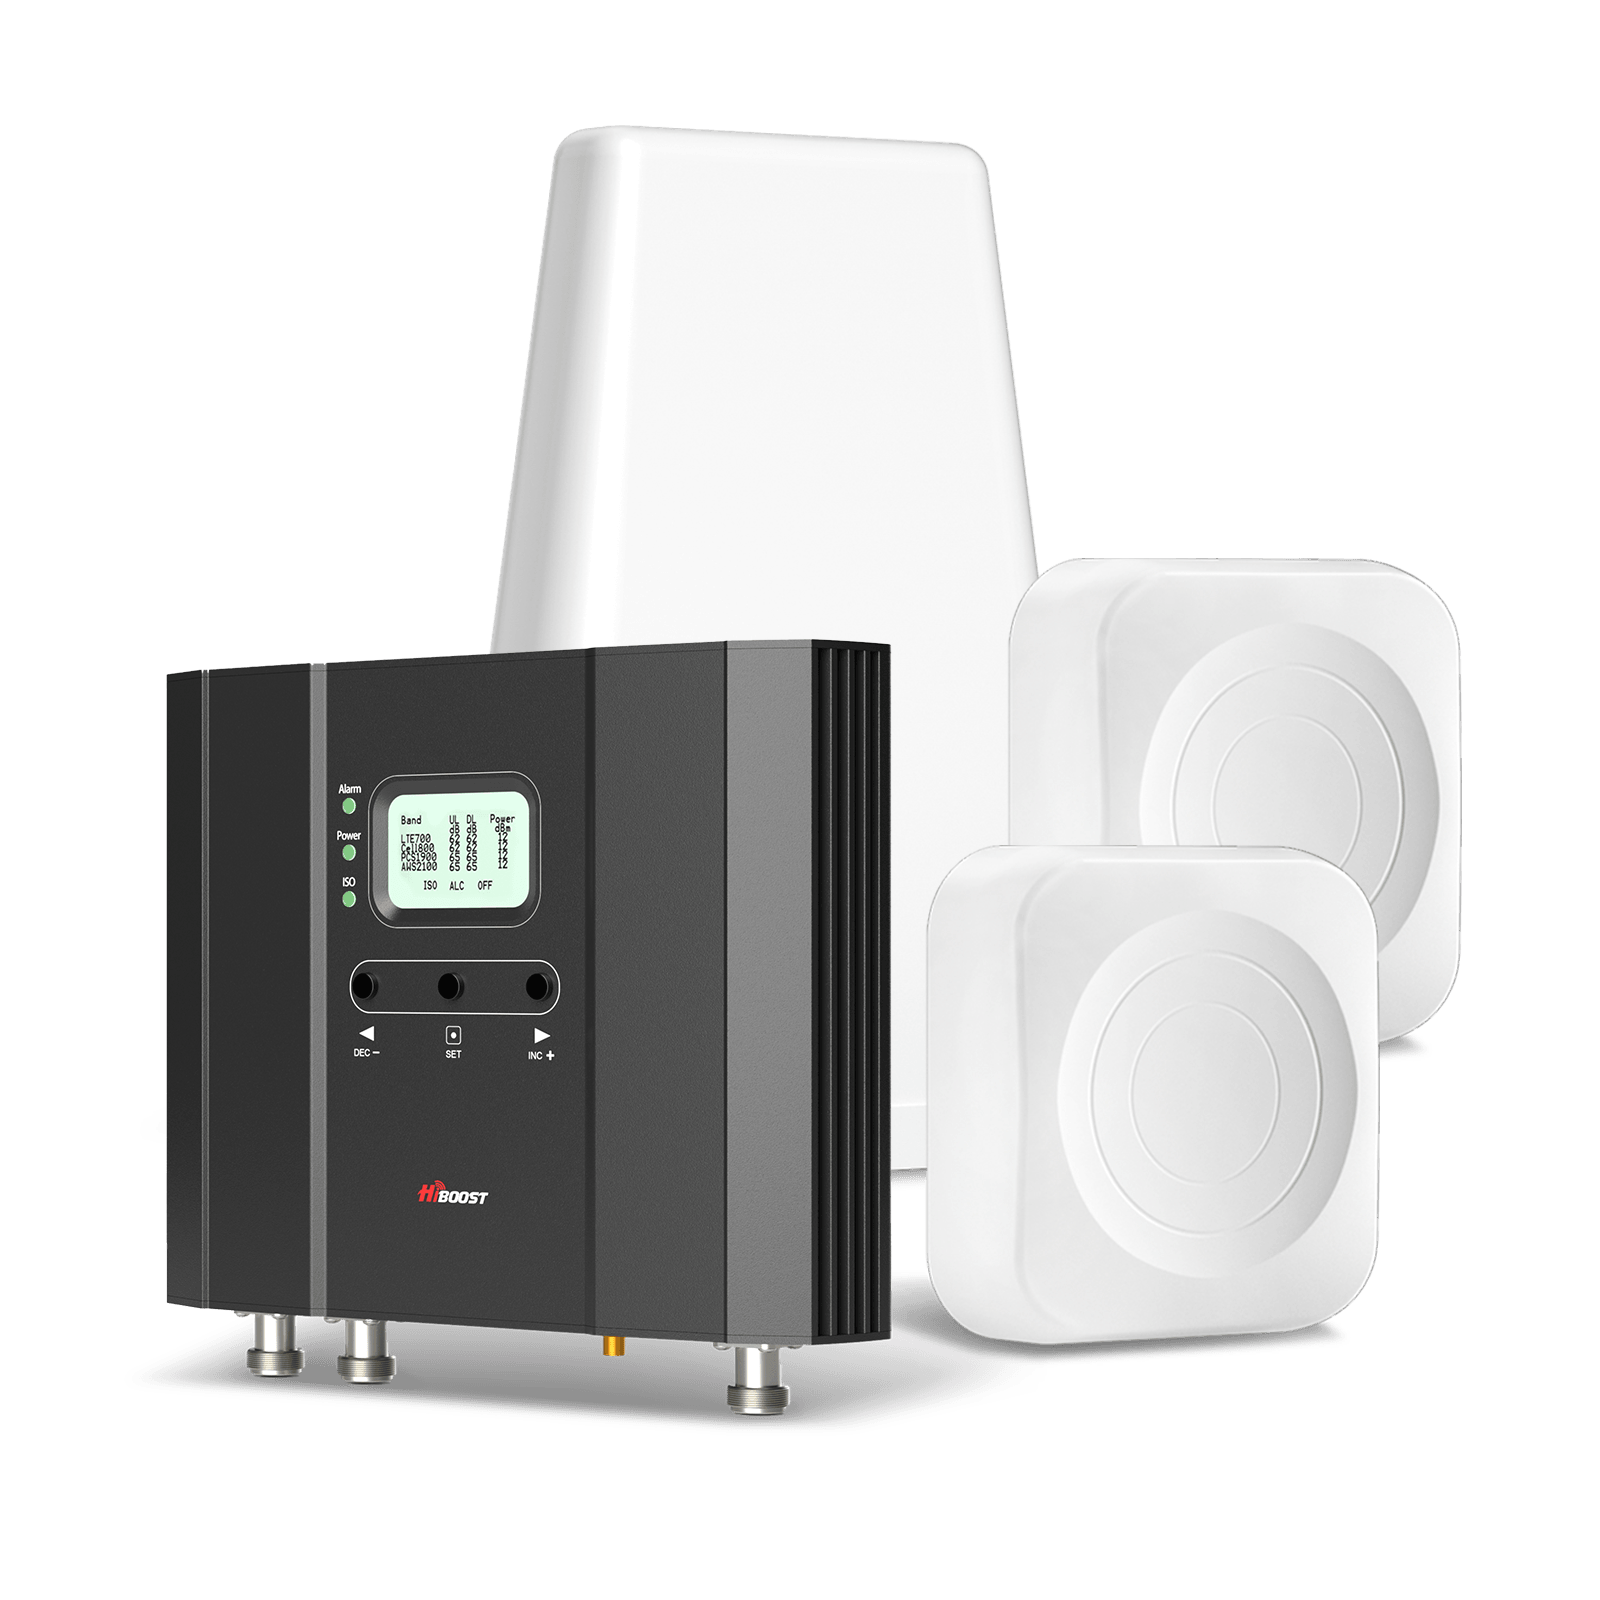
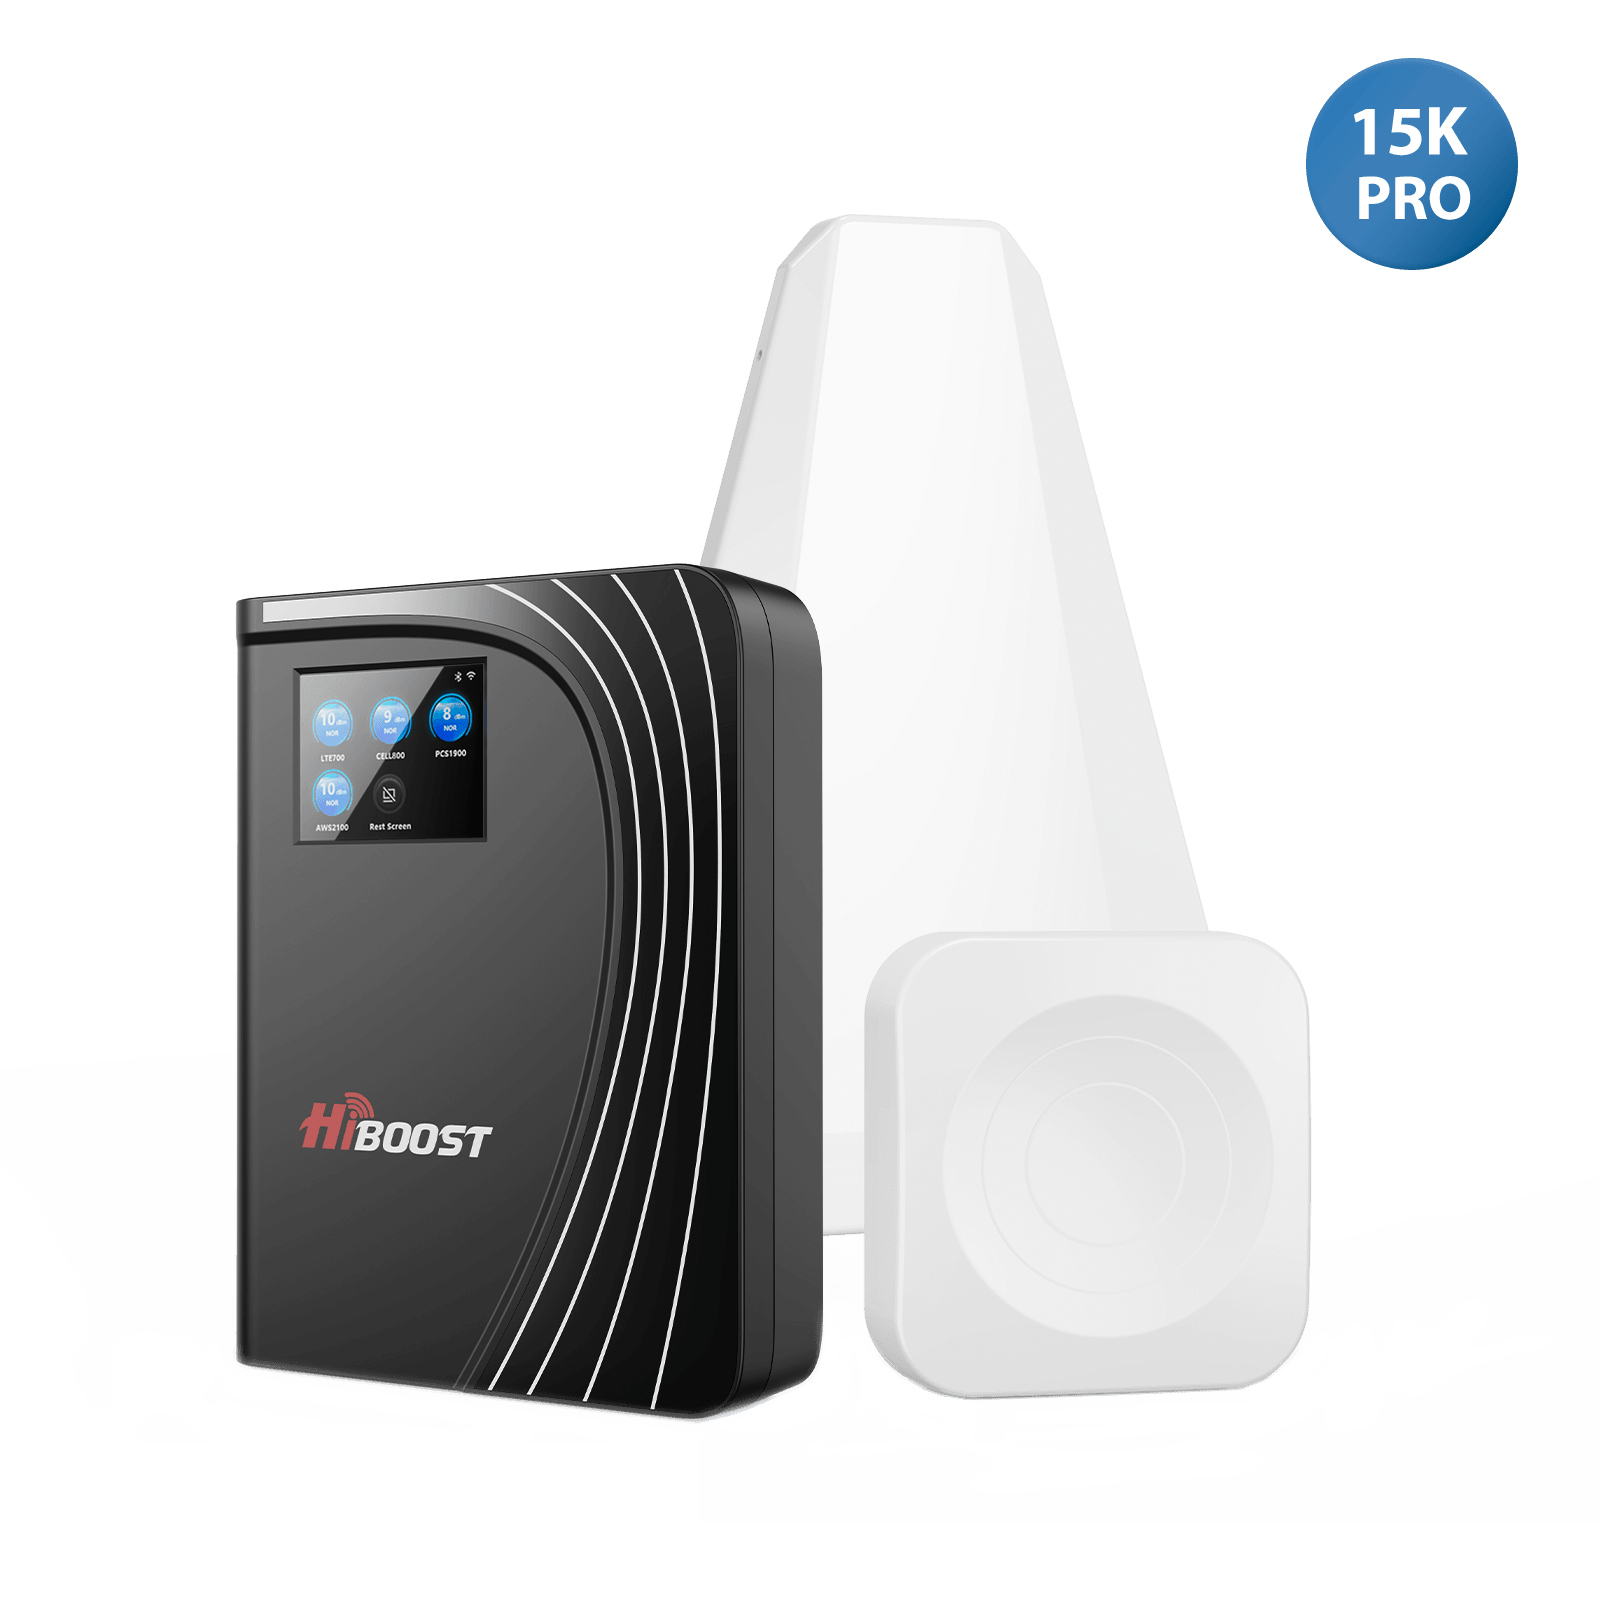
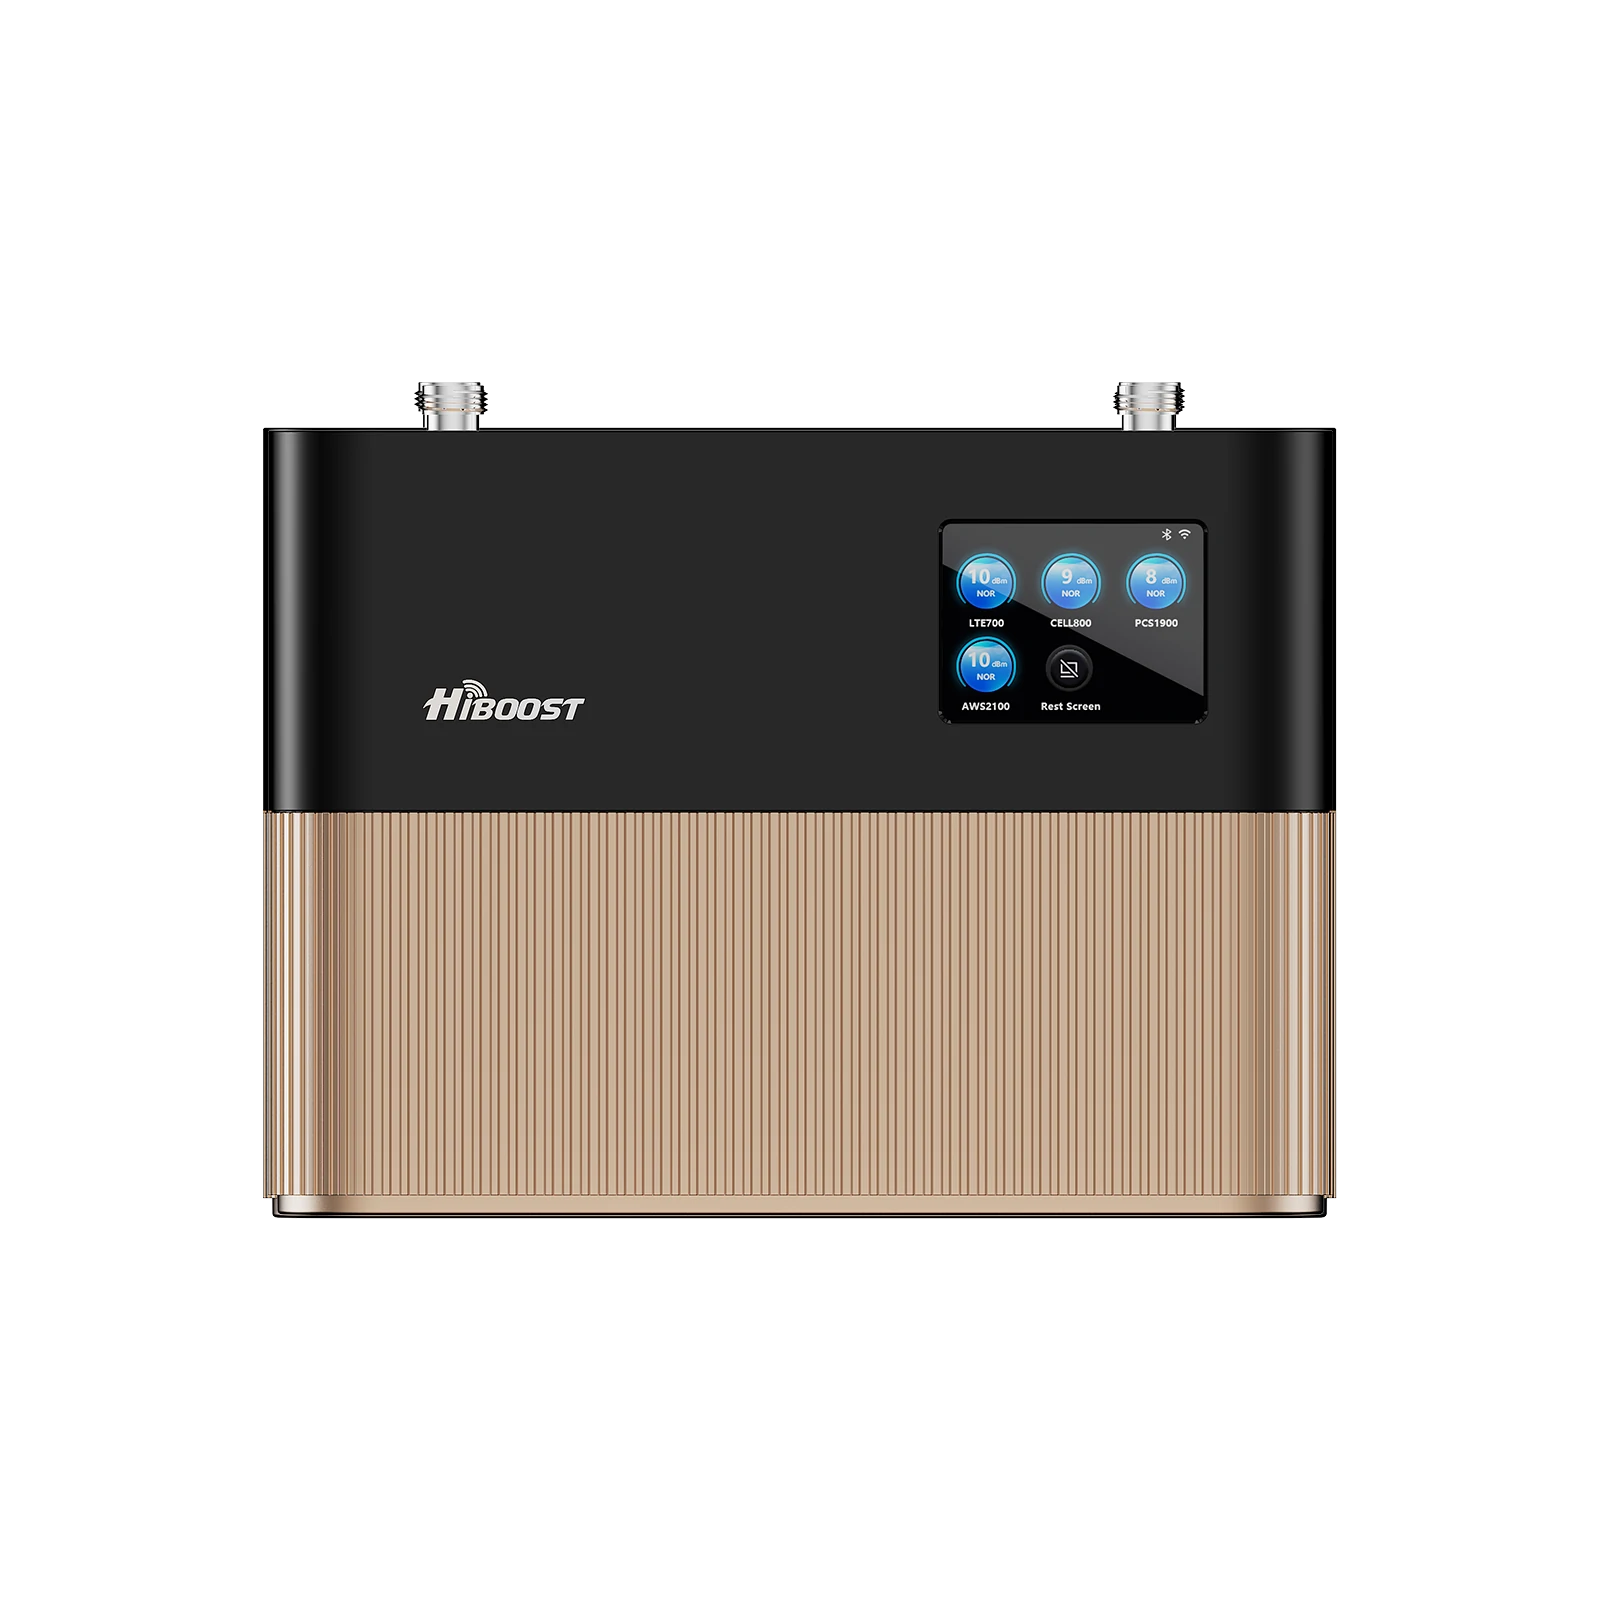
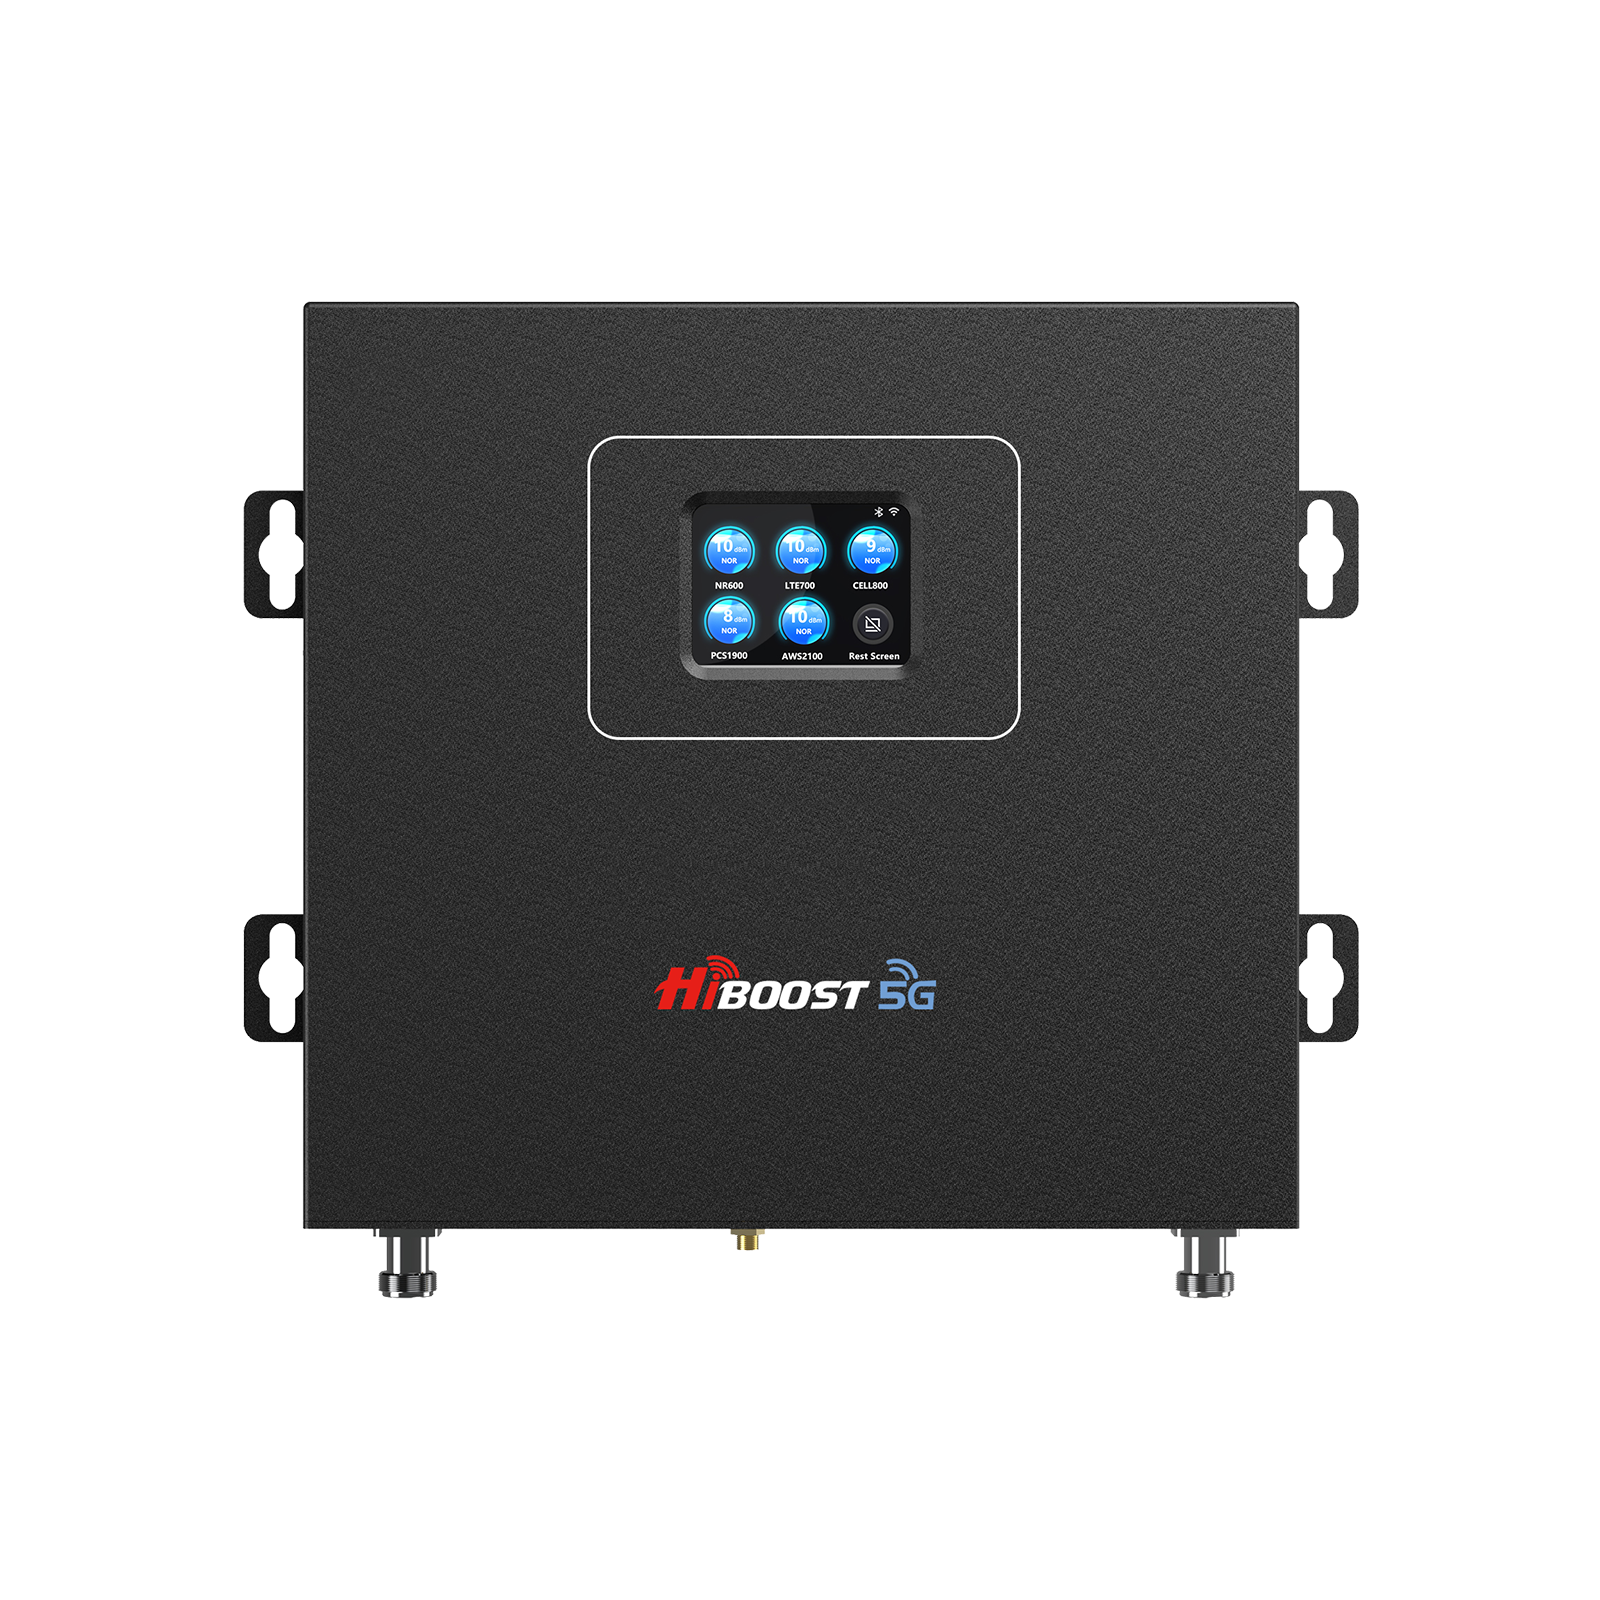
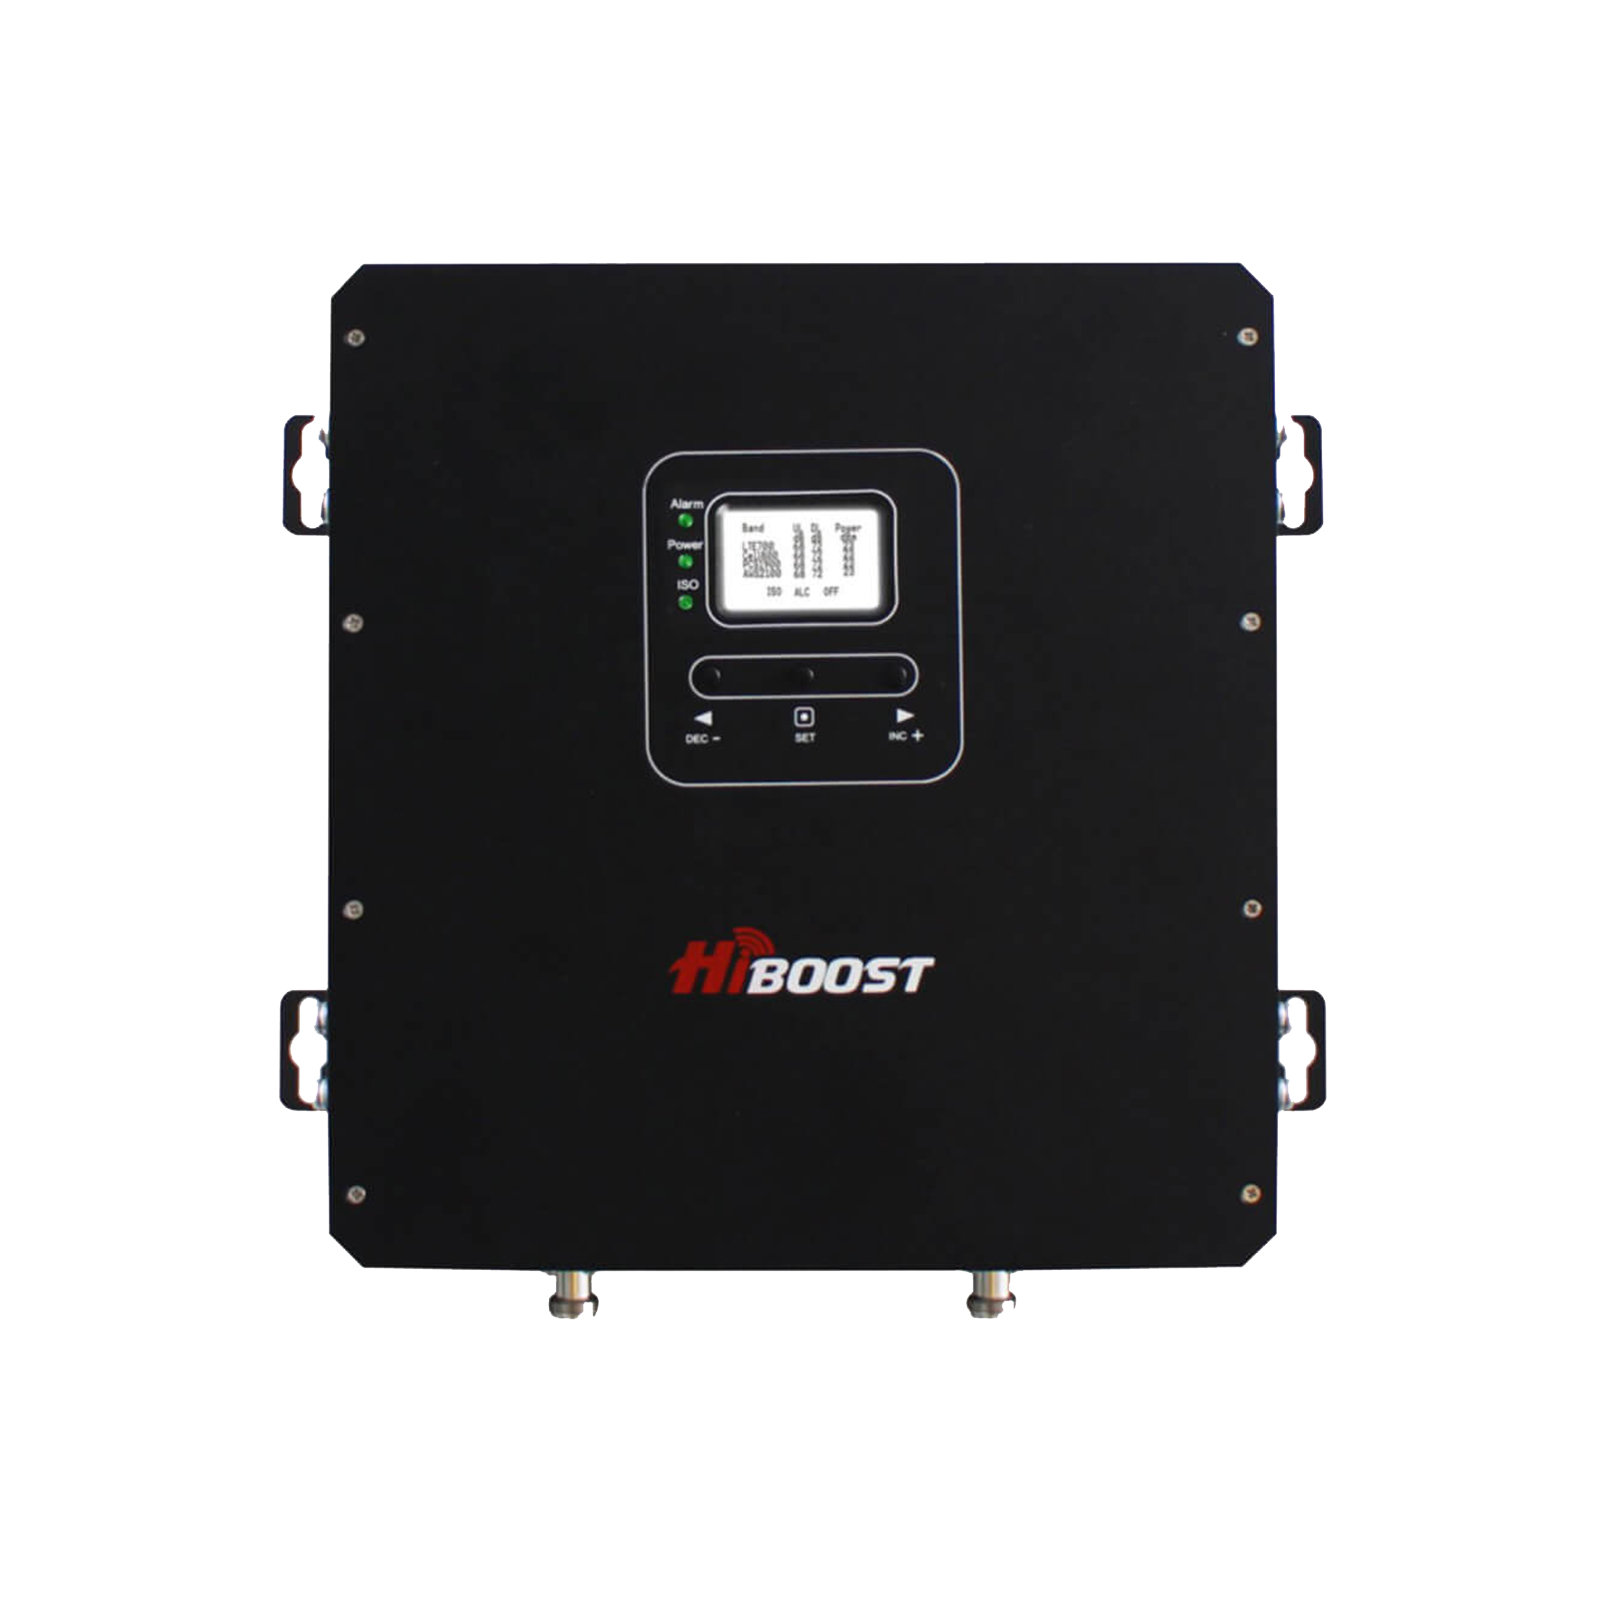
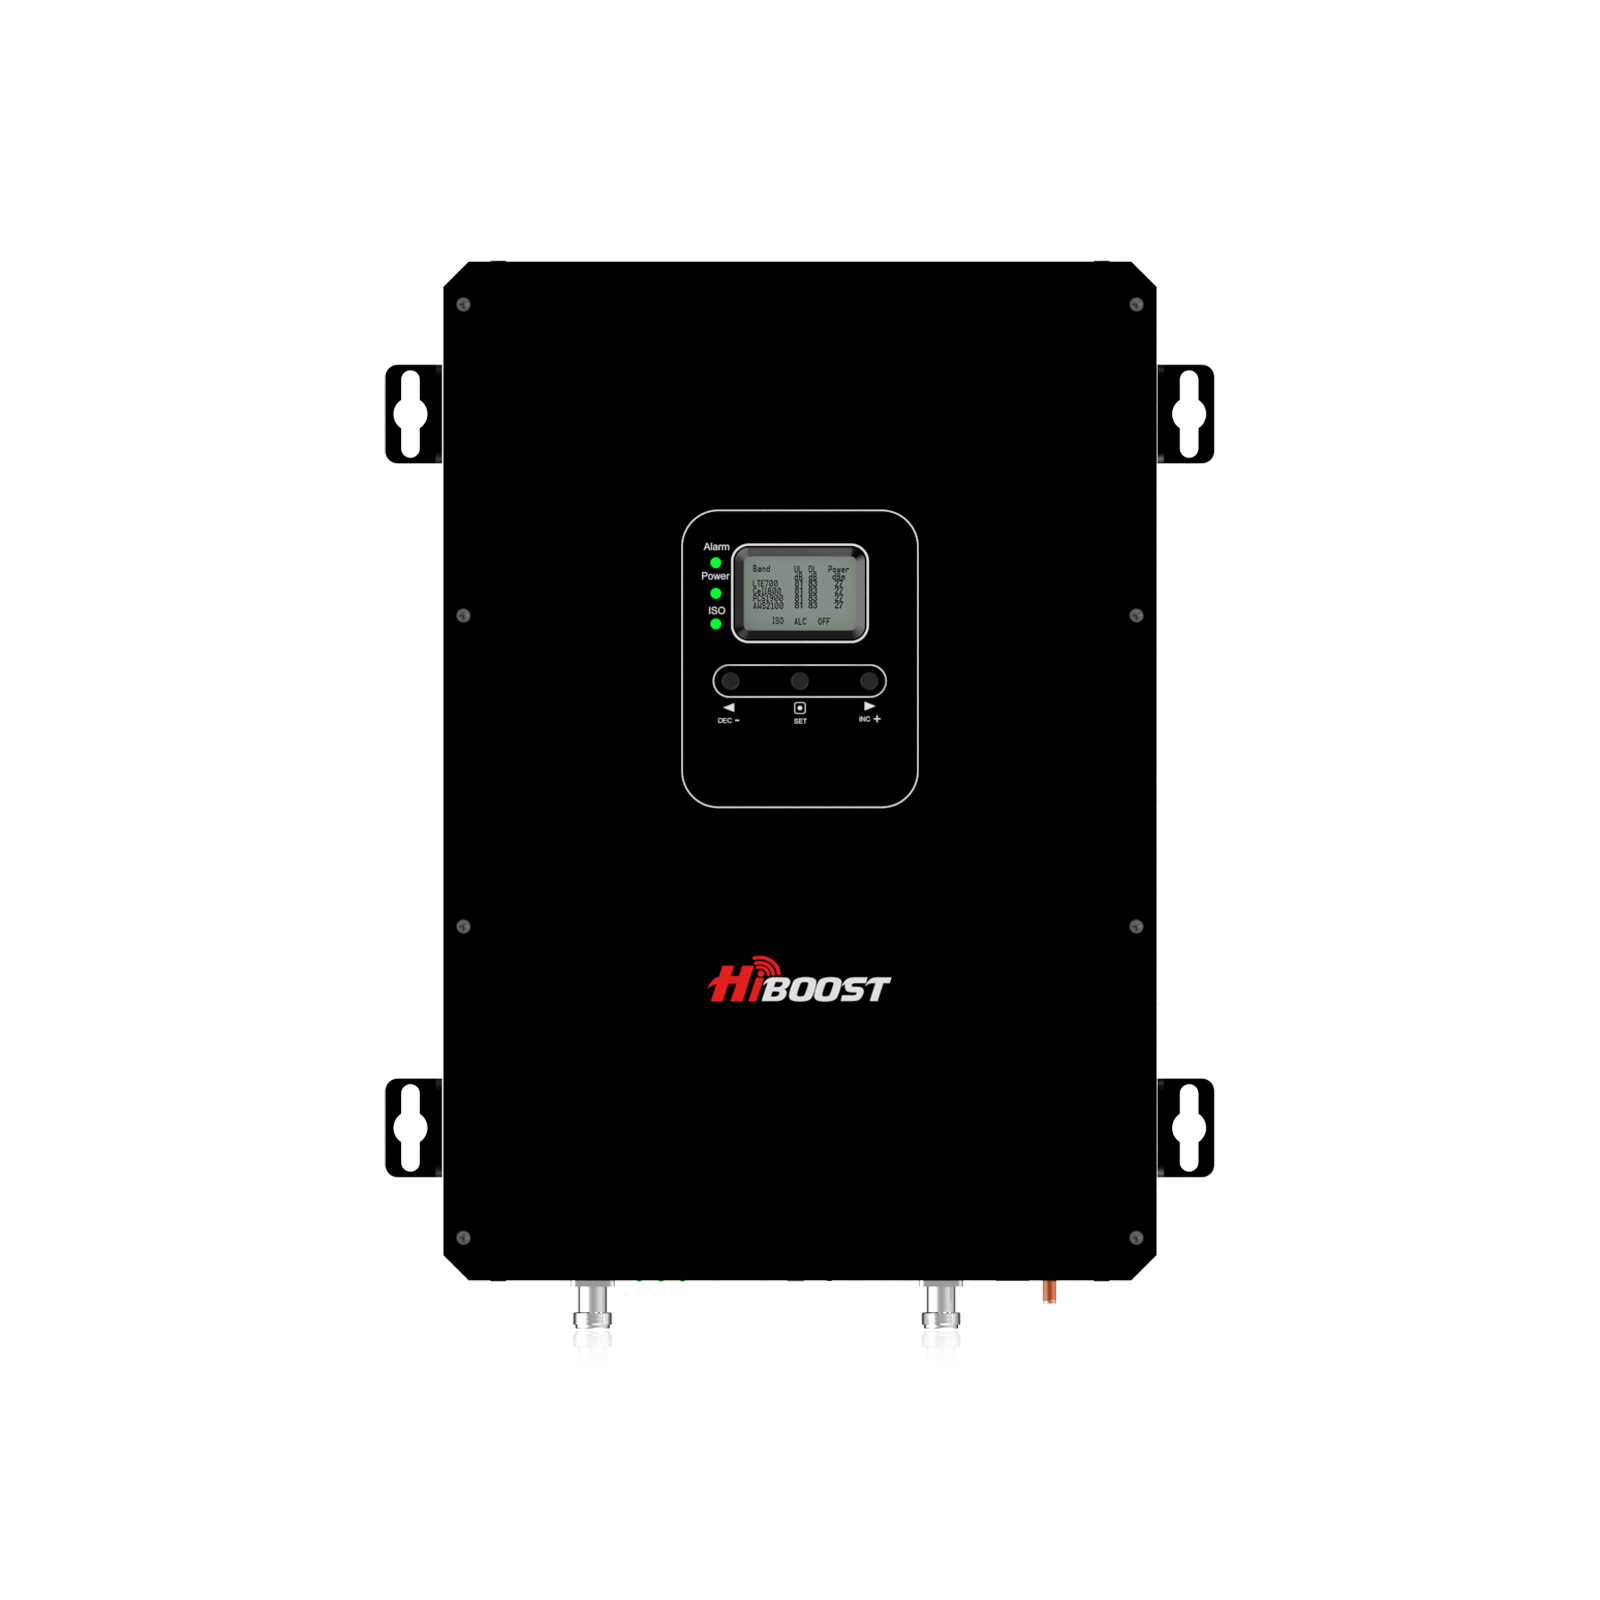
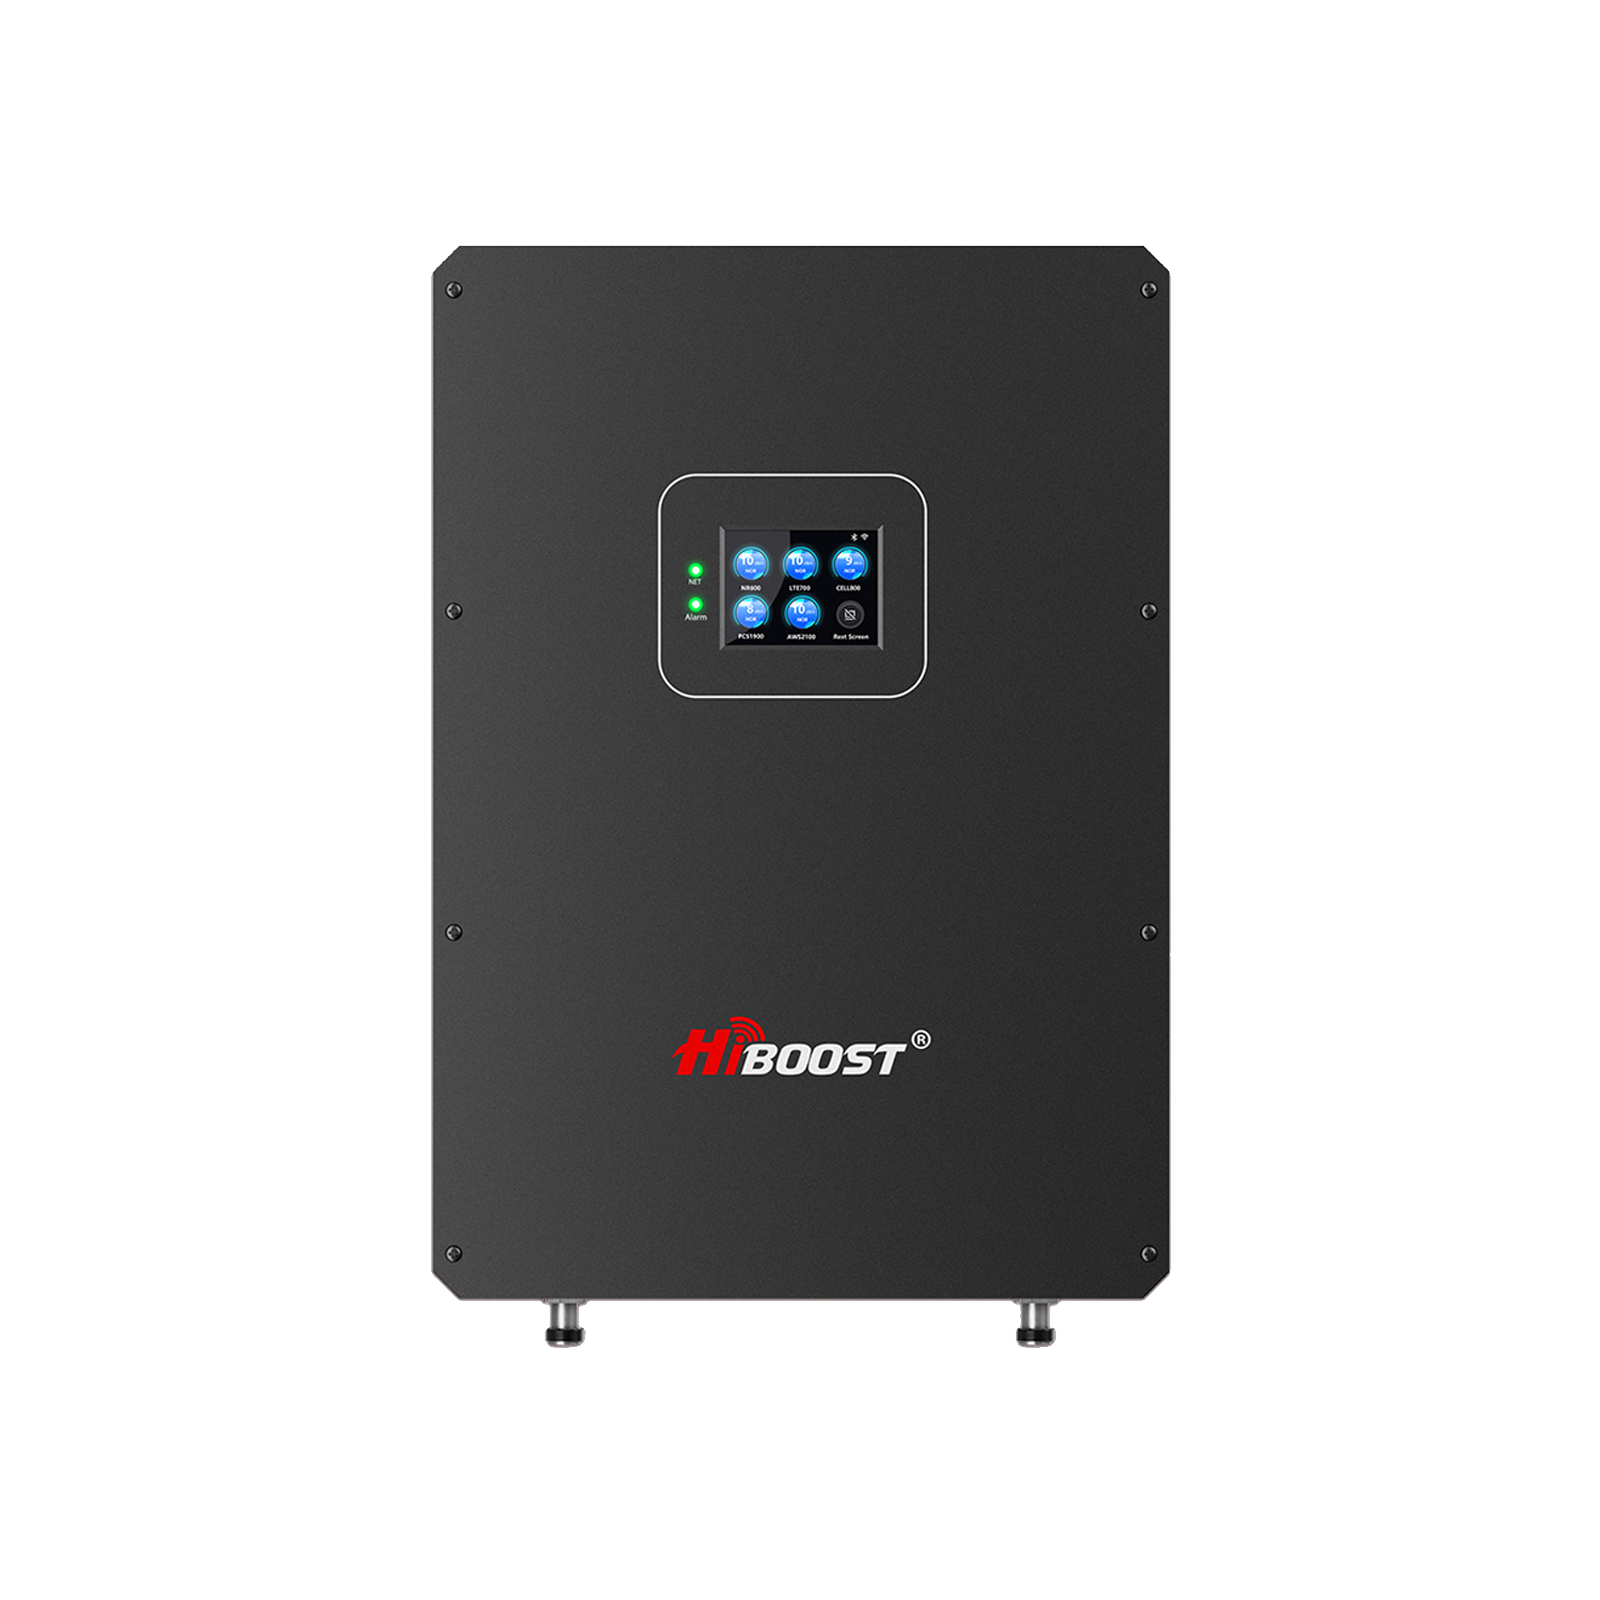
AT&T, T-Mobile, or Verizon — coverage varies by area, but a signal booster ensures your home gets strong, stable bars from any carrier. Boost all carriers at once with a multi-band system.
Explore Whole Home Boosters →1. Verizon Coverage Map
Verizon’s coverage map shows more reliable 4G and 5G coverage on the Eastern side of the country. This makes sense, as the Eastern United States is more densely populated, and the Rocky Mountains are far taller and more infrastructure-intense than the East’s Appalachians.

Coverage is slightly lacking in some Western states, predominately rural areas. 5G is currently only available in select urban and suburban areas.
Where does Verizon have the best coverage?
It’s no secret that Verizon thrives when it comes to coverage.
Coverage maps are helpful but might not tell the whole story. Here are the states where Verizon has the best 4G LTE service:
Best Verizon 4G LTE coverage by state
| State | Percentage covered |
| Kansas | 99.69% |
| Arkansas | 99.53% |
| Georgia | 99.07% |
| Indiana | 98.86% |
| South Carolina | 98.73% |
While Verizon is playing catch up on the 5G front, here are the best states for Verizon 5G:
Best Verizon 5G coverage by state
| State | Percentage covered |
| Delaware | 73% |
| New Jersey | 65% |
| Maryland | 53% |
| Connecticut | 46% |
| Ohio | 43% |
Verizon coverage by state
Want to see if Verizon has solid coverage in your area? We break down how much of each state is covered by Verizon’s network in square mileage.
Verizon Coverage by State
| State | Percentage Covered | Mile Covered (mi²) |
| Alabama | 96.46% | 49,926 mi² |
| Alaska | 1.92% | 11,428 mi² |
| Arizona | 82.01% | 93,810 mi² |
| Arkansas | 99.53% | 52,990 mi² |
| California | 74.18% | 122,015 mi² |
| Colorado | 81.67% | 85,156 mi² |
| Connecticut | 98.31% | 4,947 mi² |
| Delaware | 96.82% | 2,009 mi² |
| Florida | 94.17% | 55,258 mi² |
| Georgia | 99.07% | 58,409 mi² |
| Hawaii | 86.21% | 5,894 mi² |
| Idaho | 65.71% | 54,527 mi² |
| Illinois | 94.43% | 53,206 mi² |
| Indiana | 98.86% | 35,806 mi² |
| Iowa | 95.27% | 53,754 mi² |
| Kansas | 99.69% | 82,028 mi² |
| Kentucky | 66.00% | 26,662 mi² |
| Louisiana | 96.29% | 45,002 mi² |
| Maine | 59.32% | 19,818 mi² |
| Maryland | 92.36% | 10,079 mi² |
| Massachusetts | 96.01% | 8,016 mi² |
| Michigan | 90.18% | 53,778 mi² |
| Minnesota | 88.30% | 74,615 mi² |
| Mississippi | 97.96% | 46,719 mi² |
| Missouri | 88.19% | 61,412 mi² |
| Montana | 58.93% | 86,843 mi² |
| Nebraska | 97.48% | 75,936 mi² |
| Nevada | 59.43% | 61,795 mi² |
| New Hampshire | 84.38% | 8,147 mi² |
| New Jersey | 97.52% | 7,542 mi² |
| New Mexico | 84.53% | 101,463 mi² |
| New York | 87.21% | 42,705 mi² |
| North Carolina | 92.67% | 46,892 mi² |
| North Dakota | 97.81% | 68,393 mi² |
| Ohio | 96.18% | 39,764 mi² |
| Oklahoma | 81.96% | 57,286 mi² |
| Oregon | 74.39% | 72,327 mi² |
| Pennsylvania | 93.08% | 42,178 mi² |
| Rhode Island | 92.21% | 1,087 mi² |
| South Carolina | 98.73% | 30,821 mi² |
| South Dakota | 96.65% | 74,320 mi² |
| Tennessee | 96.59% | 40,673 mi² |
| Texas | 91.10% | 243,085 mi² |
| Utah | 78.25% | 65,286 mi² |
| Vermont | 89.91% | 8,646 mi² |
| Virginia | 93.24% | 38,050 mi² |
| Washington | 69.16% | 47,326 mi² |
| West Virginia | 52.24% | 12,650 mi² |
| Wisconsin | 87.52% | 49,834 mi² |
| Wyoming | 80.56% | 79,864 mi² |
Where does Verizon have the worst coverage?
While Verizon is the coverage king, it still has some areas where service is spotty. Verizon has the worst 4G LTE coverage in Alaska, covering just 2% of the state. Other states with potentially spotty coverage include:
• Alaska 1.92%
• West Virginia: 52.24%
• Montana: 58.93%
• Nevada: 59.43%
• Maine 59.32%
Pros and Cons of Verizon Coverage
There are many pros and cons to using a Verizon cell phone package, some of which are the incredible 4G LTE coverage, travel benefits, and great entertainment features. One notable downside is that Verizon’s cell phone packages tend to be more expensive than the competition. It’s important to weigh the pros and cons of Verizon carefully before making a decision.
Pros:
• Verizon has some of the best coverage in the country, making it a good choice for those who travel a lot or live in areas with poor cell service.
• Verizon offers good international features and high-speed hotspot data, making it • a great choice for those who travel a lot or need to work on the go.
• Verizon offers a variety of packages to choose from, including unlimited data packages, shared data packages, and prepaid packages.
• Verizon has one of the best “video experience” ratings, which means customers experience shorter load times and less lag.
• Verizon also offers great features like 5G network access in select areas, mobile hotspots, and unlimited talk and text.
• There are very few dead spots that can’t be covered.
• You can mix and match family plan options, including kids’ plans.
• Offers a wide selection of the latest smartphones, including Apple, Samsung, and Google.
Drawbacks:
• Verizon’s 5G network covers less than 11% of the US.
• Expensive Plans: Verizon’s cell phone packages tend to be expensive, more so than other carriers’ packages. If you’re on a tight budget, Verizon may not be the best choice for you.
• Limited Discounts: Verizon doesn’t offer as many discounts as other carriers. While they do offer some discounts for military, first responders, and students, they do not offer discounts for seniors or AAA members.
• Limited Data Options: Verizon offers a variety of packages, but their data options may not meet everyone’s needs. If you are a small data user, the cheapest package may be too expensive for you. If you’re a heavy user, the unlimited plan may be too expensive. Middle tier plans may not offer enough data to meet your needs.
2. AT&T Coverage Map
AT&T ranks second in 4G and 5G coverage. Its 4G network covers 68 percent of the U.S. AT&T 5G coverage is just 29 percent, reaching more than 290 million people in more than 24,000 cities and towns.

Where is the best AT&T coverage?
Typical of each big network, AT&T’s best coverage is in large metropolitan areas. Here’s a closer look at the states and cities where AT&T has the strongest coverage.
Best AT&T 4G LTE coverage by state
| State | Percentage covered |
| Delaware | 99.99% |
| Indiana | 99.99% |
| Connecticut | 99.98% |
| South Carolina | 98.98% |
| Rhode Island | 98.95% |
Best AT&T 5G coverage by state
| State | Percentage covered |
| Delaware | 99.99% |
| Indiana | 99.99% |
| Connecticut | 99.98% |
| South Carolina | 98.98% |
| Rhode Island | 98.95% |
How good is AT&T’s coverage in my area?
With few exceptions, AT&T’s coverage is highly likely to be very good in your area. Given that it covers 68% of the U.S. with its 4G LTE network—and with better rural coverage than Verizon’s network—most of the populated areas of the country have strong AT&T coverage.
AT&T coverage by state
Check out this chart to see how AT&T has each state covered:
AT&T Coverage by State
| State | Percentage Covered | Mile Covered (mi²) |
| Alaska | 11.3% | 66,986 mi² |
| Alabama | 98.73% | 51,101 mi² |
| Arkansas | 99.15% | 52,790 mi² |
| Arizona | 59.41% | 67,962 mi² |
| California | 76.08% | 120,516 mi² |
| Colorado | 79.31% | 82,700 mi² |
| Connecticut | 99.98% | 5,031 mi² |
| Delaware | 99.99% | 2,075 mi² |
| Florida | 99.04% | 58,118 mi² |
| Georgia | 99.75% | 58,118 mi² |
| Hawaii | 93.48% | 6,390 mi² |
| Iowa | 90.86% | 51,262 mi² |
| Idaho | 65.72% | 54,535 mi² |
| Illinois | 99.74% | 56,198 mi² |
| Indiana | 99.99% | 36,218 mi² |
| Kansas | 99.84% | 82,156 mi² |
| Kentucky | 99.46% | 40,177 mi² |
| Louisiana | 98.91% | 46,227 mi² |
| Massachusetts | 99.86% | 8,337 mi² |
| Maryland | 98.41% | 10,739 mi² |
| Maine | 46.58% | 15,563 mi² |
| Michigan | 97.57% | 58,180 mi² |
| Minnesota | 97.36% | 82,276 mi² |
| Missouri | 98.02% | 68,257 mi² |
| Mississippi | 98.01% | 46,743 mi² |
| Montana | 68.40% | 100,808 mi² |
| North Carolina | 93.48% | 47,301 mi² |
| North Dakota | 97.42% | 68,102 mi² |
| Nebraska | 72.59% | 56,546 mi² |
| New Hampshire | 97.96% | 9,457 mi² |
| New Jersey | 99.99% | 7,731 mi² |
| New Mexico | 80.61% | 96,757 mi² |
| Nevada | 51.42% | 57,263 mi² |
| New York | 95.33% | 46,680 mi² |
| Ohio | 99.89% | 41,297 mi² |
| Oklahoma | 96.66% | 67,556 mi² |
| Oregon | 69.54% | 67,605 mi² |
| Pennsylvania | 95.39% | 43,222 mi² |
| Rhode Island | 99.95% | 1,178 mi² |
| South Carolina | 98.98% | 30,900 mi² |
| South Dakota | 99.09% | 76,202 mi² |
| Tennessee | 94% | 39,583 mi² |
| Texas | 96.61% | 257,778 mi² |
| Utah | 83.35% | 69,010 mi² |
| Virginia | 90.20% | 36,811 mi² |
| Vermont | 99.14% | 9,534 mi² |
| Washington | 79.33% | 54,290 mi² |
| Wisconsin | 91.45% | 50,743 mi² |
| West Virginia | 92.61% | 22,426 mi² |
| Wyoming | 54.63% | 53,169 mi² |
Pros and Cons of AT&T Coverage
As with any carrier, there are pros and cons to choosing an AT&T cell phone package, but the pros (such as great coverage, great features and international deals) often outweigh the cons, not the least of which is the higher price of AT&T packages.
Pros:
• AT&T’s 4G LTE network covers 68% of the U.S. and 5G coverage covers 29% of the country, with extremely fast 5G speeds, primarily in urban and suburban areas, and a robust 4G LTE network to fall back on.
• AT&T’s 5G network is available nationwide to customers with 5G phones and packages.
• AT&T’s latency is the lowest of the major carriers, meaning it has the shortest latency at less than 50 milliseconds.
• AT&T has partnered with T-Mobile to deliver the highest quality voice calls through apps like WhatsApp, Facebook Messenger and Skype.
• AT&T has the fastest download speeds at 32.6Mbps (July 2020)
• With a large selection of postpaid and prepaid packages for a huge selection of wireless services, AT&T offers everything from comprehensive unlimited packages to prepaid limited data packages to fit your needs and budget.
• Like many major carriers, AT&T entices customers with its generous mobile data and hotspot tethering allowances. At the top end with AT&T’s Unlimited Premium plan, you’ll enjoy truly unrestricted premium data that doesn’t slow regardless of how much you use, along with a whopping 50GB mobile hotspot allocation.
Cons:
• AT&T has the lowest video experience ratings (lag, resolution, video load time, etc.) of the major carriers.
• AT&T phone packages can be expensive.
• AT&T’s 5G+ network is only available as a public hotspot in some areas.
• AT&T’s network is objectively strong, but it’s also right in the middle of its competitors—it falls behind Verizon’s in 4G coverage and behind T-Mobile’s in 5G coverage. Its plan prices are slightly lower than T-Mobile’s, but also slightly higher than Verizon’s—and you don’t get any included perks like you do from T-Mobile, or the option for add-ons like Verizon provides.
3. T-Mobile Coverage Map
T-Mobile’s 4G LTE coverage is currently the third-best in the country, behind Verizon and AT&T. Their 4G LTE network covers 62% of the United States, while its 5G network covers over 40% of the country.

Where is the best T-Mobile coverage?
You’ll find the best T-Mobile coverage in major cities and highly populated suburban areas, especially if you’re in the Eastern half of the U.S.
Here are the cities and states with the best 4G LTE T-Mobile coverage.
T-Mobile 4G coverage: Best states & cities
| States | Cities |
| Connecticut—98% | Washington, D.C.—100% |
| New Jersey—98% | Atlanta, GA—99.9% |
| Delaware—97% | Fort Worth, TX—99.9% |
| South Carolina—80% | New York, NY—99.9% |
| Indiana—95% | Nashville, TN—99.8% |
If you’re looking for 5G service from T-Mobile, here are the best places to find it.
T-Mobile 5G coverage: Best states & cities
| States | Cities |
| South Carolina—98% | Washington, D.C.—100% |
| New Jersey—79% | Indianapolis, IN—99.4% |
| Minnesota—77% | Cincinnati, OH—99.7% |
| Indiana—74% | Charlotte, NC—99.3% |
| North Carolina—72% | Houston, TX—98.8% |
Where does T-Mobile have the worst coverage?
the following states all have less than half their area covered by T-Mobile’s network:
Alaska: 0% coverage
Nebraska: 20% coverage
Oregon: 43% coverage
Maine: 43% coverage
West Virginia: 43% coverage
T-Mobile coverage by state
Curious how T-Mobile’s coverage compares state by state? Use this handy chart to get the quick rundown, and click on an individual state to check out our full coverage guide on it.
T-Mobile Coverage by State
| State | Percentage Covered | Mile Covered (mi²) |
| Alabama | 81.84% | 42,362 mi² |
| Alaska | 0% | 0 mi² |
| Arizona | 58.80% | 67,267 mi² |
| Arkansas | 89% | 47,384 mi² |
| California | 72.69% | 112,804 mi² |
| Colorado | 60.38% | 62,951 mi² |
| Connecticut | 98.44% | 4,957 mi² |
| Delaware | 96.83% | 2,009 mi² |
| Florida | 88.14% | 51,178 mi² |
| Georgia | 90.65% | 53,450 mi² |
| Hawaii | 63.06% | 4,311 mi² |
| Idaho | 50.36% | 41,792 mi² |
| Illinois | 86.11% | 48,518 mi² |
| Indiana | 95.87% | 34,724 mi² |
| Iowa | 65.35% | 36,871 mi² |
| Kansas | 86.07% | 70,823 mi² |
| Kentucky | 86.43% | 34,901 mi² |
| Louisiana | 92.31% | 43,142 mi² |
| Maine | 25.49% | 8,516 mi² |
| Maryland | 93.34% | 10,187 mi² |
| Massachusetts | 94.26% | 7,870 mi² |
| Michigan | 84.64% | 50,470 mi² |
| Minnesota | 87.60% | 78,171 mi² |
| Mississippi | 68.5% | 32,667 mi² |
| Missouri | 81.04% | 56,434 mi² |
| Montana | 57.56% | 84,830 mi² |
| Nebraska | 14.38% | 11,200 mi² |
| Nevada | 58.95% | 65,646 mi² |
| New Hampshire | 76.75% | 7,405 mi² |
| New Jersey | 97.85% | 7,565 mi² |
| New Mexico | 88.59% | 106,322 mi² |
| New York | 84.29% | 41,270 mi² |
| North Carolina | 83.20% | 42,103 mi² |
| North Dakota | 83.59% | 47,103 mi² |
| Ohio | 95.13% | 39,189 mi² |
| Oklahoma | 94.45% | 66,012 mi² |
| Oregon | 47.27% | 45,949 mi² |
| Pennsylvania | 92.94% | 42,110 mi² |
| Rhode Island | 91.44% | 1,078 mi² |
| South Carolina | 96.29% | 30,060 mi² |
| South Dakota | 76.21% | 58,602 mi² |
| Tennessee | 75.29% | 31,704 mi² |
| Texas | 85.92% | 229,252 mi² |
| Utah | 66.12% | 55,161 mi² |
| Vermont | 60.92% | 5,858 mi² |
| Virginia | 81.55% | 33,277 mi² |
| Washington | 62.86% | 43,012 mi² |
| West Virginia | 42.17% | 10,214 mi² |
| Wisconsin | 72.61% | 40,672 mi² |
| Wyoming | 52.28% | 51,832 mi² |
Pros and Cons of T-Mobile Coverage
There are many pros and cons to using a T-Mobile cell phone package, but the pros (such as great coverage, travel features, entertainment benefits, and total price) often outweigh the cons.
Pros:
• T-Mobile’s 4G LTE network covers 63% of the country.
• T-Mobile’s 5G network has the widest coverage, covering 37% of the U.S.
T-Mobile offers the best quality calls through voice calling apps like Skype, Facebook Messenger, and WhatsApp.
• T-Mobile has the fastest upload speeds, averaging 10.5Mbps.
• T-Mobile has the highest ranked gaming experience, which means less latency and better control.
• The phone has the best network performance with a fast 4G network. It also offers a variety of unlimited plans.
• T-Mobile packages are priced with taxes and fees included and tend to be a bit more affordable than Verizon and AT&T packages.
• Unlimited packages are more affordable than AT&T and Verizon, and come with a lot of perks!
Drawbacks:
• T-Mobile’s 3G network only covers 21% of the U.S.
• T-Mobile’s 4G coverage is uneven in parts of the West and Midwest. Coverage in rural areas is minimal, with a large gap from the Midwest to the West Coast.
• T-Mobile’s 5G speeds are fairly slow compared to other 5G networks.
• T-Mobile 4G LTE network coverage isn’t as good as the competition, though it depends on your area.
4. US Cellular Cell Phone Coverage Map
Sprint’s network coverage ranks fourth among all major cellular networks in the United States. With Sprint out of the picture, US Cellular is the fourth-largest mobile network with the least coverage footprint. Respectively, US Cellular’s 4G network covers about 10% of the country, with 5G covering even less.
us cellular cell phone booster

Updated Carrier Coverage Comparison (2025)
Coverage Overview Table
| Carrier | 4G LTE Coverage (Land / Population) | 5G Coverage |
Network Experience Score |
Notable Developments |
|
Verizon |
~99% of population, strongest in rural areas | ~9% nationally |
#1 in Opensignal (9.6/10) |
Consistently rated best for reliability and performance |
|
AT&T |
~58% land area, reaches >99% population | ~29% nationally | — |
Acquired $23B in spectrum to boost low/mid-band and fiber expansion |
|
T-Mobile |
~43% land area via US Mobile “Light Speed,” broad population reach | Leading 5G coverage (~36%) | Most improved — now top ranked carrier |
Ultra Capacity 5G covers 300M+ people, average speeds ~400 Mbps |
|
U.S. Cellular |
~10% 4G LTE coverage |
~5% 5G coverage |
— |
Specialized regional coverage, particularly Midwest and Northwest |
Coverage Insights
Key Takeaways:
- Verizon remains the standard for wide-reaching 4G coverage, especially in rural areas, and offers best-in-class network experience (Opensignal 9.6/10)
- AT&T is strong in both 4G and 5G and is further expanding with a recent $23 billion acquisition of spectrum licenses to enhance coverage and infrastructure.
- T-Mobile leads in 5G coverage and performance, now recognized as the top U.S. carrier by Tom’s Guide, thanks to perks and network performance.
- U.S. Cellular offers localized reliability but has limited national reach.
How Do Carriers Compare in 2025?
HiBoost boosters support AT&T, T-Mobile, Verizon, and all major carriers simultaneously. Ensure smooth calls and fast data in every room.
Shop Whole Home Systems →Below is a summary table highlighting how major U.S. carriers stack up on coverage, performance, and future-ready initiatives:
Coverage Snapshot: Verizon still leads in rural 4G reliability and overall network experience, AT&T fortifies both 4G/5G through major spectrum investments, T-Mobile dominates the 5G landscape with its Ultra Capacity rollout, and U.S. Cellular provides solid regional service in select areas.
Carriers are actively expanding 5G—T-Mobile and AT&T especially—but rolling out maps may not fully reflect real-world reception, so users are encouraged to check maps directly or test signal strength at specific locations.
Which Cell Phone Carrier Has the Most Cell Phone Coverage?
Just because one carrier has the most coverage, doesn’t mean they offer the best. To crown the carrier with the best coverage, we looked at Open Signal’s coverage availability analysis. It measures what proportion of time people have a network connection in the places they most commonly frequent.
Which Cell Phone Carrier Has the Best Nationwide Cell Phone Coverage?
For strictly 5G availability, T-Mobile is the champion, which is not surprising since they have the largest 5G coverage.

Overall, the choice of carrier will depend on factors such as the coverage in your area, the types of plans and features that are important to you, and your budget. It is important to compare the plans and coverage of each carrier before making a decision.
To choose the best booster for your carrier and region, review your coverage map and then explore our tailored HiBoost solutions.
Now I’d like to hear from you. Which carrier do you use currently? Are you happy with your provider or are you considering one of the other Big Four? Do you have any advice for others who might be shopping for a wireless service? Sound off in the comments below.
Recommended Reading
5G vs 4G Coverage: What Matters More for Reliable Signal?
Best Cell Reception in My Area: How to Find the Strongest Signal
How to Check If Verizon, AT&T, or T-Mobile Works Best at Your Location




4 comments
rent_jfmr
The benefits of renting a car while traveling, which you will definitely appreciate
rent_uesn
Book your car right now, the lowest prices.
XRumer23jenry
Hey people!!!!!
Good mood and good luck to everyone!!!!!
Squiercex
handwritten by the author.
Leave a comment
All comments are moderated before being published.
This site is protected by hCaptcha and the hCaptcha Privacy Policy and Terms of Service apply.