
Everyone has had the experience at one time or another of being in a location that had poor cellular service. It may have been on a road trip, inside a basement, at Aunt Rose’s farm or at a sporting event. There are many factors that influence how and if a good signal reaches our mobile devices. Radio signals used in radiotelephony fade significantly over distance, it is something that is factored into the design of the system. It allows frequencies to be re-used repeatedly and thus vastly increases the number of subscribers that can communicate with one another. Radio signals also can be blocked by terrain, buildings, vehicles and even people. Each tower location can only support a finite number of users. In some cases, it is not economically feasible for carriers to provide services in certain areas. Other areas may have an excessive amount of interference from other radio frequency sources. For our discussion, we will classify good signals under the following criteria:
1. Calls do not drop
2. Voice calls are intelligible and at or near full fidelity, without excessive background noise
3. Data can be uploaded and downloaded at a rate consistent with the design of the device and the type of plan the customer subscribes to
What about bars? Bars are more a marketing tool than a measurement tool. In fact, the carriers and device manufacturers program mobile devices to show what they want you to see. Two bars on one carrier can be four bars on another. There is, in fact, no standard that anyone goes by or that is enforced by consumer groups or regulators. It is the wild west out there!
There are charts on the internet that try to equate the number of bars you have with the strength of your signal. Just remember that strength and quality are two separate issues. A poor quality “strong” signal can be next to useless, but a clean signal of two bars might be all your device needs.
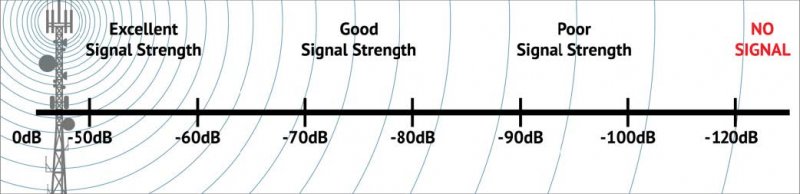
The figure directly above displays a range decibels (dB) relative to the distance from a cell phone tower. The higher dB represents what good and poor signals look like when measured with a signal meter. Keep in mind, some areas with an excellent signal will measure over -50 dB. For example, the signals can reach into the high -30’s while in a downtown area where there are several cell phone towers. Note that the closer the number gets to zero the better the signal. The more negative a signal becomes the worse it gets. -50 is very good, -100 is just at the edge of the usable signal.
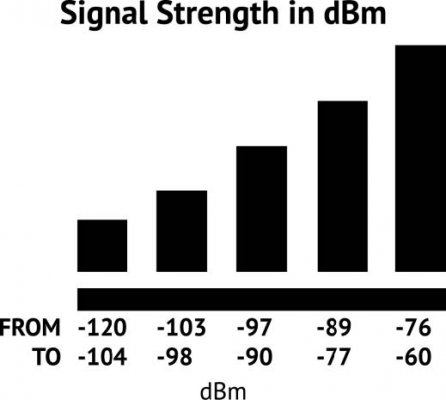
The figure above represents a signal strength measurement of your phone from the cell phone tower. If you are curious about how to measure signal quality, see the figure below. Please note that this quality measurement system is used for 4G LTE only. Below the figure is an explanation of what terms means.
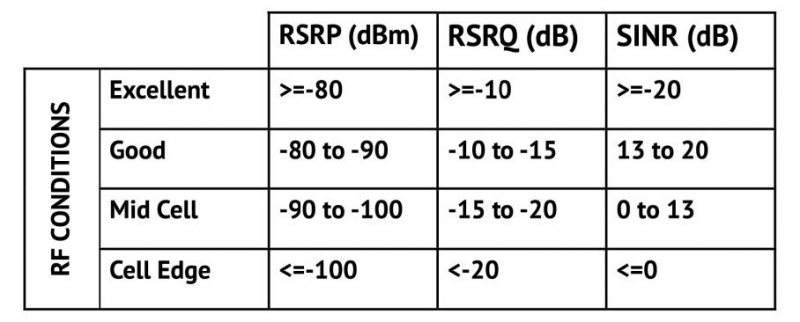
SINR/SNR – The signal-to-noise ratio of the given signal.
RSRP – The average power received from a single reference signal. Its typical range is around -44dbm (good) to -140dbm(bad).
RSRQ – Indicates the quality of the received signal. Its range is typically -19.5dB(bad) to -3dB (good).